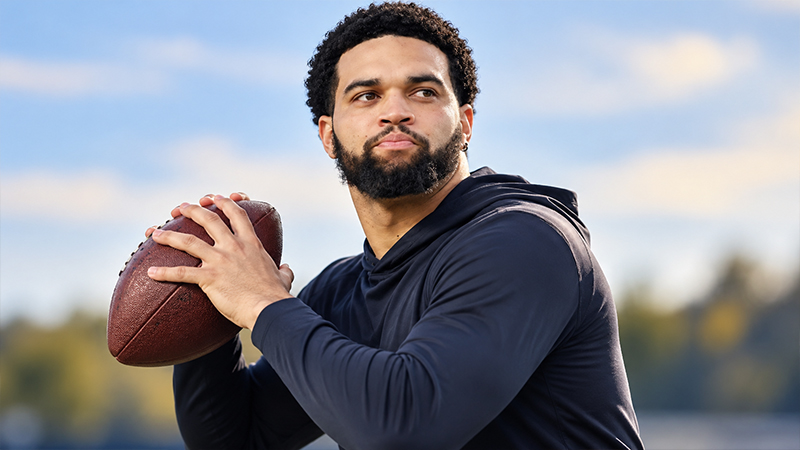
When the Chicago Bears selected Caleb Williams first overall in the 2024 NFL Draft out of USC, they envisioned a new era at quarterback.
Entering the league at 22, Williams faced enormous expectations while carrying a reputation for exceptional arm talent, creativity, rushing ability, and deep-ball accuracy.
His transition required adapting to faster defensive processing, complex pre-snap reads, tighter throwing windows, and relentless pass rushes.
Williams immediately became Chicago’s starter, making 17 starts as a rookie while managing a significant passing workload and navigating challenging pocket situations.
Rookie Year Summary: Navigating 2024 Under Pressure
| Rookie Season Metric | 2024 Value |
|---|---|
| Games Started / Played | 17 / 17 |
| Completions / Attempts | 351 / 562 |
| Completion Percentage | 62.5% |
| Passing Yards | 3,541 |
| Passing Touchdowns | 20 |
| Interceptions Thrown | 6 |
| Yards Per Attempt (YPA) | 6.3 |
| Sacks Taken / Lost Yards | 68 / 466 |
| Passer Rating / QBR | 87.8 / 43.3 |
| Rushing Yards / Touchdowns | 489 / 0 |
A critical storyline during Williams’ 2024 campaign was pass-protection durability and pocket pressure.
He was sacked 68 times for a loss of 466 yards, reflecting both offensive line inconsistencies and a young quarterback holding onto the football while searching for extended downfield plays.
Despite high sack totals, Williams protected the football in the air, maintaining an impressive 3.33 touchdown-to-interception ratio (20 TDs against 6 INTs).
On the ground, Williams added an immediate secondary dimension to Chicago’s offense during his first year. He logged 81 rushing carries for 489 rushing yards, averaging 6.0 yards per carry with a long run of 24 yards and 27 rushing first downs converted.
Ball security while scrambling remained an area for growth, as he logged 6 fumbles with 2 lost according to defensive tracking records, or 10 total fumbles with 5 lost according to primary league logs.
The Year 2 Leap: 2025 Performance Analysis
Pocket Discipline & Pass Protection Optimization
Year 2 marked a significant step forward in Williams’ professional evolution, characterized by increased quick-game processing, improved pocket management, and dramatic efficiency gains across 17 starts in 2025.
His most notable statistical achievement between 2024 and 2025 was a 64.71% reduction in sacks taken, dropping from 68 sacks in 2024 down to 24 sacks in 2025. Sack yardage lost fell proportionately from 466 yards down to 165 yards.
2024 Sacks Taken:  [==================================================] 68 Sacks
2025 Sacks Taken:  [==================] 24 Sacks (-64.71% Reduction)
This structural improvement in sack avoidance directly fueled expanded passing production. Williams raised his passing output to 3,942 yards and 27 passing touchdowns while maintaining tight turnover control with only 7 interceptions on 568 pass attempts.
His yards per attempt increased from 6.3 to 6.9 yards, while his maximum long pass play expanded to 65 yards.
Although his raw completion rate dipped to 58.1% (330 completions on 568 attempts), his overall passer efficiency elevated to a 90.1 passer rating, and his ESPN QBR surged from 43.3 up to 58.2.
These figures demonstrate an offensive system operating with higher-variance downfield shots, deeper air yards per attempt, and more effective red-zone scoring sequences.
Dual-Threat Versatility & Goal-Line Execution
Beyond traditional passing metrics, Williams expanded his goal-line usage and scoring impact during his second season.
In 2025, he logged 77 rushing carries for 388 rushing yards (5.0 yards per carry) and secured 3 rushing touchdowns. He achieved 28 rushing first downs and recorded a season-long scramble of 29 yards.
Furthermore, Chicago’s offensive staff utilized Williams in creative trick-play and gadget concepts near the goal line.
Williams caught 2 pass receptions for 22 receiving yards (11.0 yards per reception), including a 20-yard receiving touchdown.
| Scoring & Utility Metric | 2024 Season | 2025 Season | Career Progression |
|---|---|---|---|
| Passing Touchdowns | 20 | 27 | +35.0% Increase |
| Rushing Touchdowns | 0 | 3 | +3 Goal-Line TDs |
| Receiving Touchdowns | 0 | 1 | +1 Gadget TD |
| Total Touchdowns Responsible | 20 | 31 | +55.0% Total Output |
| Individual Points Scored | 0 | 24 | 4 Total Touchdowns |
| Fumbles Lost | 2 / 5 | 0 / 1 | Enhanced Ball Security |
Combined across all phases, Williams was directly responsible for 31 total touchdowns in 2025 (27 passing, 3 rushing, 1 receiving), scoring 24 points directly through non-passing touchdowns.
He also demonstrated superior fumble control, recording 0 lost fumbles on 7 recorded ground drops in ESPN metrics, or 1 lost fumble on 9 total drops in official NFL log tracking.
Early 2026 Momentum and Key Performances
High-Efficiency Start to the 2026 Season
| 2026 Early Season Metric | Williams Performance | League / Position Ranking |
|---|---|---|
| Passing Completion Rate | 65.5% | Career-High Mark |
| Passing Yards | 407 | 203.5 Yards / Game |
| Yards Per Pass Attempt | 7.40 | Career-High Efficiency |
| Passer Rating | 92.0 | Continuous Peak Growth |
| Total ESPN QBR | 86.1 | Ranked 2nd in the NFL |
| Rushing Yards / Average | 107 YDS / 7.1 AVG | Dynamic Ground Mobility |
Game-by-Game Variance: Breakdown of Week 1 vs. Week 2
A closer look at Williams’ game log for the 2026 regular season illustrates single-game performance dynamics against varying defensive structures.
- Week 1 @ Carolina Panthers (Chicago Won 59-37): Williams delivered one of the most productive single-game performances of his career. He completed 21 of 29 passes (72.4%) for 269 passing yards, 2 passing touchdowns, 0 interceptions, and 9.28 yards per attempt, earning a stellar 124.1 passer rating. He was sacked just twice for 8 lost yards. On the ground, he added 10 carries for 65 rushing yards (6.5 YPC) and 2 rushing touchdowns, accounting for 4 total touchdowns in a high-scoring road victory.
- Week 2 vs. Minnesota Vikings (Chicago Lost 3-9): Facing an aggressive divisional blitz scheme, Williams encountered heavy defensive resistance. He completed 15 of 26 passes (57.7%) for 138 passing yards, 0 passing touchdowns, and 1 interception, averaging 5.31 yards per attempt with a 56.2 passer rating. He was sacked 3 times for 20 lost yards. While passing rhythm was disrupted, he still provided ground yardage with 5 carries for 42 rushing yards (8.4 YPC) despite 1 non-lost fumble.
Navigating Injury & The Bears’ NFC North Outlook
The Multi-Week Injury Setback
Following Chicago’s 27-7 Week 3 victory over the Philadelphia Eagles, football analysts confirmed that Caleb Williams is expected to miss multiple weeks due to an injury setback sustained during game play.
The unexpected loss of Chicago’s starting quarterback presents an immediate challenge for the franchise as it balances offensive continuity against competitive momentum.
Media debates have emerged regarding Chicago’s capacity to remain in playoff contention while Williams recovers.
League analysts highlight that while losing an upper-tier quarterback impacts system pacing, Chicago’s defensive stability and established running game provide structural support to navigate upcoming starts.
NFC North Division Context & Playoff Trajectory
Through the first 3 weeks of the 2026 NFL regular season, the NFC North standings display tight competition across all four franchises.
| NFC North Team | Wins | Losses | Ties | Win % | Points For (PF) | Points Against (PA) | Point Differential |
|---|---|---|---|---|---|---|---|
| Minnesota Vikings | 3 | 0 | 0 | 1.000 | 71 | 41 | +30 |
| Detroit Lions | 2 | 1 | 0 | .667 | 93 | 95 | -2 |
| Chicago Bears | 2 | 1 | 0 | .667 | 89 | 53 | +36 |
| Green Bay Packers | 1 | 2 | 0 | .333 | 56 | 91 | -35 |
Chicago’s upcoming schedule includes a key home matchup at Soldier Field against the New York Jets. Preserving divisional leverage during Williams’ rehabilitation will be vital for Chicago’s postseason positioning within the NFC race.
Career Statistical Tables
Passing Performance Breakdown (2024–2026)
| Year | Team | GP | GS | CMP | ATT | CMP% | YDS | YPA | TD | INT | SACK | SCKY | RTG | QBR |
|---|---|---|---|---|---|---|---|---|---|---|---|---|---|---|
| 2024 | CHI | 17 | 17 | 351 | 562 | 62.5% | 3,541 | 6.30 | 20 | 6 | 68 | 466 | 87.8 | 43.3 |
| 2025 | CHI | 17 | 17 | 330 | 568 | 58.1% | 3,942 | 6.94 | 27 | 7 | 24 | 165 | 90.1 | 58.2 |
| 2026 | CHI | 2 | 2 | 36 | 55 | 65.5% | 407 | 7.40 | 2 | 1 | 5 | 28 | 92.0 | 86.1 |
| Total | CHI | 36 | 36 | 717 | 1185 | 60.5% | 7,890 | 6.66 | 49 | 14 | 97 | 659 | 89.1 | — |
Rushing & Receiving Performance Breakdown
| Year | Team | GP | RUSH CAR | RUSH YDS | AVG | RUSH TD | LONG | REC | REC YDS | REC TD | TOTAL PTS |
|---|---|---|---|---|---|---|---|---|---|---|---|
| 2024 | CHI | 17 | 81 | 489 | 6.0 | 0 | 24 | 0 | 0 | 0 | 0 |
| 2025 | CHI | 17 | 77 | 388 | 5.0 | 3 | 29 | 2 | 22 | 1 | 24 |
| 2026 | CHI | 2 | 15 | 107 | 7.1 | 2 | 29 | 0 | 0 | 0 | 12 |
| Total | CHI | 36 | 173 | 984 | 5.7 | 5 | 29 | 2 | 22 | 1 | 36 |
Single-Game Log Summary (2026 Regular Season)
| Week | Opponent | Result | CMP/ATT | CMP% | PASS YDS | YPA | PASS TD | INT | SACK | RTG | RUSH CAR | RUSH YDS | RUSH TD |
|---|---|---|---|---|---|---|---|---|---|---|---|---|---|
| WK 1 | @ Panthers | W 59-37 | 21/29 | 72.4% | 269 | 9.28 | 2 | 0 | 2 | 124.1 | 10 | 65 | 2 |
| WK 2 | vs Vikings | L 3-9 | 15/26 | 57.7% | 138 | 5.31 | 0 | 1 | 3 | 56.2 | 5 | 42 | 0 |
| WK 3 | vs Eagles | W 27-7 | — | — | — | — | — | — | — | — | — | — | — |
Conclusion
Caleb Williams’ evolution from first overall draft pick to franchise leader illustrates steady multi-year technical growth.
His ability to correct rookie pocket vulnerabilities—slashing his sack totals by 64.71% from 2024 to 2025 while increasing touchdown volume from 20 to 27—demonstrates strong processing capability and adaptive growth.
Caleb Williams Career Touchdown Production Breakdown:
- Passing Touchdowns:   [==================================================] 49 TDs
- Rushing Touchdowns:   [====] 5 TDs
- Receiving Touchdowns: [=] 1 TD
Total Responsible: 55 Touchdowns
His dynamic goal-line utility, evidenced by 5 rushing touchdowns and 1 receiving touchdown, adds flexibility to Chicago’s offensive playbook.
Furthermore, early 2026 performance indicators—including an 86.1 QBR (ranked 2nd in the NFL) and a career-high 65.5% completion rate—confirm that Williams was reaching peak efficiency prior to his Week 3 injury setback.
As Chicago (2-1) navigates his multi-week recovery schedule, maintaining structural discipline and leveraging their top-ranked divisional point differential (+36) will determine whether the team stays firmly in NFC North title contention.
Once fully recovered, Williams possesses the statistical progression, efficiency metrics, and dual-threat playmaking required to anchor Chicago’s offense for years to come.