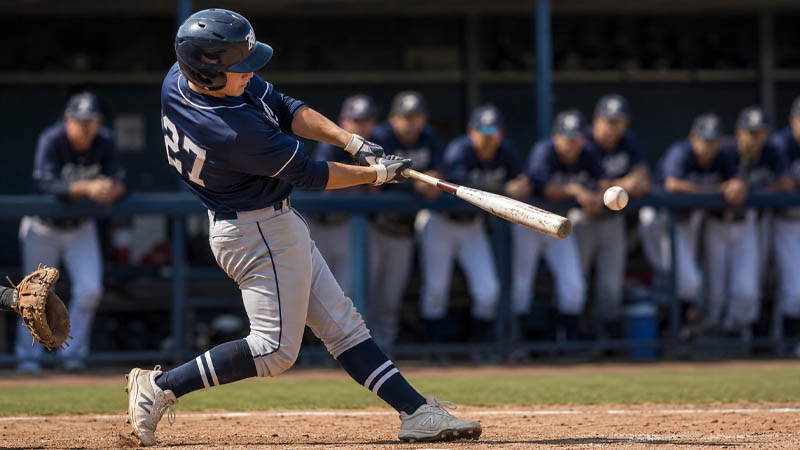
In youth baseball, hitting a round ball with a round bat is widely celebrated as one of the most difficult feats in sports. For decades, players, parents, and coaches have turned to a single statistic to measure a player’s hitting success: the batting average.
The classic target has always been the mythical .300 average, a number that has symbolized batting excellence for generations of ballplayers.
However, evaluating performance has undergone a fundamental transformation. Historically, a college scout or talent evaluator might have stood behind the backstop relying solely on a radar gun, a manual stopwatch, and basic handwritten notes.
In today’s modern competitive environment, evaluations look entirely different. Decision-makers now utilize advanced tools, real-time data tracking, video analysis, and precise performance metrics during every single plate appearance.
Because of this analytical shift, answering the question “what is a good batting average” with just a single number is no longer sufficient.
Batting average remains a highly valuable quick reference, the most widely understood statistic in the sport, and the first entry people check on a stat sheet.
However, its true value is unlocked only when analyzed in context with competition levels, position requirements, and modern supporting metrics.
The Core Calculation: Deciphering the Math Behind the Stat
To understand what makes a batting average strong, players must first understand exactly how it is calculated. The basic formula is straightforward:
Batting Average (BA)= Hits/AT-Bats
The result is always expressed as a three-decimal number, representing the percentage of time a player records a hit. For example, a player who records 45 hits in 150 official at-bats has a batting average of .300, meaning they get a hit in exactly 30% of their at-bats.
However, the key to understanding this statistic lies in what the denominator excludes. An “at-bat” (AB) is not the same as a “plate appearance” (PA). To evaluate individual offensive contributions accurately, certain plate outcomes are removed from the batting average calculation entirely.
At-Bat vs. Plate Appearance Outcomes
An official at-bat is defined as any plate appearance that results in a hit, an out (other than sacrifice plays), or a fielder’s choice. Other outcomes are excluded from at-bats because they do not reflect a failure to hit, but rather a successful plate approach or a clinical defensive play.
The following table outlines how different plate outcomes affect a player’s statistical record:
| Plate Appearance Result | Counts as At-Bat (AB)? | Counts as Plate Appearance (PA)? |
|---|---|---|
| Hit (Single, Double, Triple, Home Run) | Yes | Yes |
| Out (Groundout, Flyout, Strikeout) | Yes | Yes |
| Walk (Base on Balls – BB) | No | Yes |
| Hit by Pitch (HBP) | No | Yes |
| Sacrifice Bunt | No | Yes |
| Sacrifice Fly | No | Yes |
| Catcher’s Interference | No | Yes |
This distinction explains why batting average alone is an incomplete measure of a hitter’s true value. A disciplined batter who draws numerous walks will show a significantly higher on-base percentage than their batting average, keeping their team’s offense moving even on days when the hits aren’t falling.
High School Batting Average Tiers: Establishing the Benchmarks
When evaluating high school varsity players, batting average benchmarks are significantly higher than those seen in professional baseball.
While a major league player hitting .300 is considered elite, a high school player hitting .300 is actually performing below the varsity average.
To provide clear targets for players and coaches, high school batting averages are categorized into distinct performance tiers:
   Elite:      .420+  =========================================== (Scout Target)
   Great: .380-.419  =================================== (Lineup Anchor)
   Good:  .330-.379  =========================== (Reliable Contributor)
   Average:.270-.329  ==================== (Varsity Baseline)
The Performance Tiers Defined
- Elite Tier (.420 and Above): This is rare, highly productive territory. Hitters performing at this level typically lead their local or regional leagues in multiple offensive categories. A batting average above .420 demonstrates exceptional barrel control, elite pitch recognition, and the ability to hit high-quality pitching consistently. Players in this bracket attract heavy, proactive recruiting interest from premier college programs.
- Great Tier (.380 to .419): A player in this range shows strong, highly consistent control at the plate and typically anchors the middle of a competitive high school lineup. This average proves that the player is a consistent offensive threat who rarely gives away at-bats, making them a prime candidate for collegiate evaluation.
- Good Tier (.330 to .379): Hitting in this range puts a player well above the standard high school varsity baseline. It indicates reliable contact skills, solid plate coverage, and a consistent ability to contribute to the team’s run production.
- Average Tier (.270 to .329): This is the standard baseline for a functional, contributing varsity starter. While a .300 average in this tier is a respectable high school metric, it does not typically stand out on its own for higher-level college recruiting unless paired with exceptional speed, elite defense, or high-end physical metrics.
The Context Shift: Why Level of Play Changes the Meaning of the Numbers
A common mistake made by players and parents is comparing a player’s high school or travel team statistics directly to Major League Baseball benchmarks. To understand where a player truly stands, one must look at how the averages shift across different competitive levels.
At younger levels of play, pitching quality is highly inconsistent. Pitchers throw fewer strikes, possess less velocity, and rarely throw deceptive off-speed pitches.
At the same time, youth hitters are facing defensive units that struggle to make routine plays, leading to highly inflated batting averages.
As players mature and move up the competitive pyramid, pitching velocity rises, breaking balls become highly deceptive, and defensive coverage tightens, compressing batting averages downward.
Benchmark Table
The table below shows the average, good, and elite batting benchmarks across every level of competitive baseball and softball:
| Competition Level | Average BA | Good BA | Elite BA | Major Competitive Characteristic |
|---|---|---|---|---|
| Youth (10U and Below) | ~.450 | .500+ | .600+ | Highly inconsistent pitching; focus should be entirely on development and plate discipline, not stats. |
| Youth (12U Travel Ball) | ~.400 | .430–.480 | .500+ | Pitching control is still developing; hitters with strong hand-eye coordination dominate. |
| Middle School (14U–16U Travel) | ~.350 | .380–.420 | .450+ | Averages compress toward high school standards as pitching velocity and off-speed pitches improve. |
| High School Varsity | ~.330 | .350–.380 | .400+ | Pitching consistency varies widely; elite programs see highly competitive, meaningful numbers. |
| College Baseball (NCAA D1) | ~.290 | .320–.340 | .360+ | Elite college programs look for .350+ as a key benchmark for draft-worthy prospects. |
| Minor League Baseball (MiLB) | ~.260 | .280–.300 | .320+ | Averages run slightly higher than MLB due to developmental priorities in pitching. |
| Major League Baseball (MLB) | ~.248 | .270–.290 | .300+ | The highest tier of play; averages have declined slightly in the modern era due to strikeout rates. |
| NCAA D1 Softball | ~.280 | .310–.340 | .360+ | Softball averages trend higher due to shorter pitching distances and rapid game pace. |
| High School Varsity Softball | ~.350 | .380–.420 | .450+ | Dynamic underhand delivery offers less deception than overhand curves, elevating averages. |
Positional Expectations: How Your Position Dictates Your Hitting Targets
In modern baseball evaluation, coaches do not look at a roster of nine hitters with the same offensive expectations.
Defensive demands vary wildly across the diamond, and scouts adjust their offensive benchmarks based on the physical and defensive value a player brings to their position.
A premier defensive catcher or shortstop is not evaluated by the same offensive criteria as a first baseman. Understanding these positional profiles helps players set realistic, tailored goals for their development.
               [Outfield: .305-.320+] (Speed or Power)

      [Shortstop: .310+]                  [Second Base: .310+]
     (Contact & Speed)                      (Contact & Speed)

[Third Base: .325+]                                 [First Base: .330+]
 (Strong Hitting)                                    (Power Production)

                      [Catcher: .290+]
                  (Defense & Arm Strength)
Key Positional Profiles
- Catchers (Target Average: .290+): Catchers carry the heaviest defensive burden on the field, managing the pitching staff, calling games, and blocking balls. Because of this intense physical toll and the premium placed on arm strength, scouts are highly willing to accept a slightly lower batting average in exchange for elite defensive leadership.
- Middle Infielders (Target Average: .310+): Shortstops and second basemen are expected to showcase exceptional range, quick feet, and reliable gloves. Offensively, their primary role is to act as table-setters. Evaluators prioritize high contact rates, dynamic speed, and the ability to get on base over pure power hitting.
- Corner Infielders (Third Base: .325+ / First Base: .330+): These are historically power-producing positions. First and third basemen are expected to anchor the middle of the order and drive in runs. Because their defensive range requirements are less demanding than those of middle infielders, their offensive targets are significantly higher. A corner infielder hitting an “empty” .290 with minimal power is often deprioritized in favor of a player who showcases higher run-producing metrics.
- Outfielders (Target Average: .305 to .320+): Outfield expectations depend heavily on where the player projects defensively. Center fielders are expected to showcase elite tracking speed and cover vast ground, aligning their offensive profile with middle infielders. Corner outfielders (left and right field) are expected to profile more like corner infielders, delivering strong slugging numbers and driving the baseball into the gaps.
College Recruiting Standards: What Divisions Actively Target
For high school players aspiring to play at the next level, understanding collegiate recruiting targets is essential.
Different divisions of college baseball represent distinct levels of competition, and having a realistic view of where your statistics align can help streamline the recruitment process.
While a college program will look at your overall physical tools, athletic projection, and mental makeup, they use high school performance against high-quality competition as a starting benchmark.
The table below outlines where serious recruiting interest typically begins for various college divisions:
| Division | Minimum BA | Target BA | Elite BA | Recruiting Insight |
|---|---|---|---|---|
| NCAA Division 1 | .300 | .340 | .390+ | Targets high-end athletes who can handle premium velocity and show projection. |
| NCAA Division 2 | .290 | .320 | .370+ | Highly competitive rosters; values consistent contact hitters with strong defensive skills. |
| NCAA Division 3 | .275 | .305 | .350+ | Academic-minded programs that prioritize well-rounded players with solid on-base habits. |
| NAIA | .285 | .315 | .360+ | Often features mature, highly competitive rosters with flexible athletic standards. |
| Junior College (JUCO) | .270 | .300 | .345+ | A prime developmental pathway for players to refine their tools and transition to four-year programs. |
Beyond the “Empty Average”: Modern Metrics and the Scouting Evolution
One of the most critical concepts for a modern ballplayer to master is “The Empty Average”. Some batting averages look spectacular on paper but are fundamentally misleading.
An empty average typically consists of a high volume of weak, soft hits (such as infield singles or bloopers) compiled against below-average pitching. This profile is usually characterized by an exceptionally low walk rate and little to no extra-base power.
When these players transition to face higher-level pitching—where defenders run faster, pitch velocity increases, and coaches exploit mechanical flaws—their batting average quickly plummets. Modern evaluators are highly trained to spot this and prioritize more comprehensive offensive statistics.
The Triple-Crown of Player Evaluation: BA vs. OBP vs. OPS
To construct an accurate, professional assessment of a hitter’s true value, coaches look at how batting average correlates with advanced metrics. The following table breaks down what these metrics measure and how they are benchmarked:
| Offensive Metric | What It Actually Measures | Good Benchmark | Elite Benchmark | What It Misses |
|---|---|---|---|---|
| Batting Average (BA) | Hits per official at-bat. | .270+ | .300+ | Completely ignores walks, hit-by-pitches, and the value of extra-base hits. |
| On-Base Percentage (OBP) | The total rate of safely reaching base per plate appearance. | .340+ | .380+ | Treats a walk exactly the same as a home run; ignores hitting power. |
| Slugging Percentage (SLG) | The total number of bases gained per official at-bat. | .430+ | .500+ | Ignores plate discipline, walks, and consistent on-base skills. |
| On-Base Plus Slugging (OPS) | The sum of OBP and SLG; isolates a player’s overall offensive impact. | .750+ | .900+ | Does not account for park factors or specific lineup roles. |
| Quality At-Bats (QAB) | The percentage of highly productive, competitive plate appearances. | 55–65% | 65%+ | Treats productive outs (like advancing a runner) the same as hits. |
The Power of Schedule Strength and Showcases
In 2026, scouts place immense emphasis on the environment where a player’s statistics are generated. Playing in a weak local league can easily inflate a hitter’s average, but facing highly competitive pitching will test their true abilities.
To build a profile that commands attention, competitive high school players should focus on:
- Playing on Travel Teams: Joining highly competitive travel ball teams exposes players to elite pitching prospects from other regions, giving scouts a realistic look at how their bat performs against high-end velocity.
- Attending Showcase Events: Showcases provide standardized performance environments. Recording high exit velocities and displaying consistent contact rates in front of scouts often carries significantly more recruiting weight than high school statistics alone.
Historical Context: Why a .400 Batting Average is a Modern Myth in MLB
In the long history of professional baseball, hitting .400 represents the pinnacle of hitting mastery.
The legendary Ted Williams was the last Major League Baseball player to achieve this feat, hitting .406 over the course of the historic 1941 season. Since then, no big-league hitter has managed to cross that sacred threshold.
The table below highlights some of the greatest pure hitters in baseball history and their career achievements:
| Player | Career BA | Era of Play | Notable Career Hitting Achievement |
|---|---|---|---|
| Hugh Duffy | N/A | 1894 | Recorded the highest single-season average in baseball history at .440. |
| Ty Cobb | .366 | 1905–1928 | Holds the all-time career batting average record, which will likely never be broken. |
| Rogers Hornsby | .358 | 1915–1937 | Achieved a .424 average in 1924, the highest single-season average of the 20th century. |
| Shoeless Joe Jackson | .356 | 1908–1920 | Holds the third-highest career average in history despite his early exit from the game. |
| Ted Williams | .344 | 1939–1960 | The last MLB player to hit over .400 in a season (.406 in 1941). |
| Tony Gwynn | .338 | 1982–2001 | Captured eight batting titles while famously never striking out more than 40 times in a single season. |
Why We No Longer See .400 Hitters in the Big Leagues
The disappearance of the .400 hitter in modern professional baseball is not due to a decline in athletic talent, but rather the rapid evolution of defensive and pitching systems:
- Pitching Specialization and Advanced Bullpens: In the era of Ty Cobb or Ted Williams, starting pitchers frequently threw complete games, allowing hitters to face the same tired arm three or four times in a single matchup. Today, modern bullpens are filled with specialized relief pitchers throwing high-velocity pitches. Hitters rarely see the same pitcher twice in a game, constantly facing fresh, elite arms.
- The Power of Defensive Positioning: Teams now use data-driven defensive positioning. By analyzing exactly where a player tends to hit the ball, defensive units position themselves to turn hard-contact hits into routine groundouts or flyouts.
- A Shift in Offensive Strategy: Modern offensive baseball has largely shifted its focus from pure contact to maximizing launch angle and exit velocity. Teams are highly willing to accept a higher rate of strikeouts in exchange for the run-producing value of extra-base hits and home runs.
Actionable Player Development: How to Systematically Improve Your Average
Improving a batting average requires consistent, deliberate practice. Simply taking aimless swings in a batting cage will not translate to success against high-quality pitching.
To build a high-performing batting average, high school players should focus on four foundational pillars of player development:
      +-------------------------------------------------------------+
      |               FOUR PILLARS OF HITTER DEVELOPMENT            |
      +-------------------------------------------------------------+
      |  1. PLATE DISCIPLINE      | Wait for pitches in your zone;  |
      |                           | eliminate chasing bad balls.    |
      +---------------------------+---------------------------------+
      |  2. PITCH RECOGNITION     | Read release points early to    |
      |                           | improve reaction speed.         |
      +---------------------------+---------------------------------+
      |  3. EXIT VELOCITY         | Build physical power to turn    |
      |                           | weak contact into hard hits.    |
      +---------------------------+---------------------------------+
      |  4. VIDEO ANALYSIS        | Record swings to find and fix   |
      |                           | minor mechanical flaws.         |
      +-------------------------------------------------------------+
1. Refine Your Plate Discipline
Great hitting begins with pitch selection. Swinging at pitches outside of your preferred hitting zone leads to weak contact, easy defensive plays, and high strikeout numbers. To train this skill:
- Use disciplined cage sessions where you only swing at strikes, training your eyes to lay off borderline pitches.
- Understand that drawing a walk is a highly positive offensive contribution that keeps your on-base percentage high and creates scoring opportunities.
2. Focus on Pitch Recognition
The faster a hitter can identify a pitch, the more time they have to execute a controlled, powerful swing. To improve your tracking:
- Practice reading the pitcher’s release point and identifying spin early during bullpen sessions or live batting practice.
- Focus on recognizing pitch trajectory and movement patterns to make better swing decisions.
3. Increase Your Exit Velocity
Hitting the ball hard is one of the best ways to elevate your batting average. Hard-hit balls run through infield gaps faster, carry deeper into the outfield, and give defensive players less time to make a play.
- Incorporate focused strength training and rotational power exercises into your weekly training program.
- Measure your progress using exit velocity tools during training sessions, aiming to hit the ball with consistent power.
4. Utilize Video Analysis
Consistent mechanics are essential for sustaining a high batting average over a long high school season.
- Have a coach or parent record your swings during practice and competitive games.
- Review the footage regularly to check your hand path, hip rotation, and overall balance.
- Identifying and correcting minor mechanical adjustments early prevents long hitting slumps.
The Bottom Line: Building a Complete Offensive Profile
Ultimately, your batting average is just one part of a much larger analytical picture. While hitting .400 is an impressive milestone, modern baseball scouts and college coaches are looking for complete, well-rounded players.
An elite batting average means very little if it is built on weak contact against poor competition.
To build an offensive profile that translates to higher levels of play, focus on:
- Maximizing Quality Contact: Work on hitting the ball hard consistently, rather than just trying to guide it into the field.
- Developing Elite Plate Discipline: Take pride in drawing walks, working deep counts, and keeping your on-base percentage high.
- Exposing Yourself to Top Pitching: Test your skills in high-level travel ball tournaments and showcase events to prove your bat can handle premium velocity.
By focusing on overall performance, physical development, and a strong plate approach, you will build an offensive game that stands out to scouts and prepares you for the next level.