Baseball, often referred to as America’s pastime, is a sport that captivates millions of fans around the world. From the crack of the bat to the cheers of the crowd, every moment on the baseball diamond is filled with excitement.
One integral part of the baseball experience is the scoreboard, displaying essential information about the game’s progress. To the uninitiated, deciphering the various numbers and abbreviations on a baseball scoreboard can be quite overwhelming.
Fear not, for in this comprehensive guide, we will break down the intricacies of a baseball scoreboard and teach you how to read it like a seasoned fan.
Components of a Baseball Scoreboard
To begin decoding a baseball scoreboard, it’s essential to understand its various components. A typical baseball scoreboard consists of multiple sections that provide crucial information about the game. These components include:
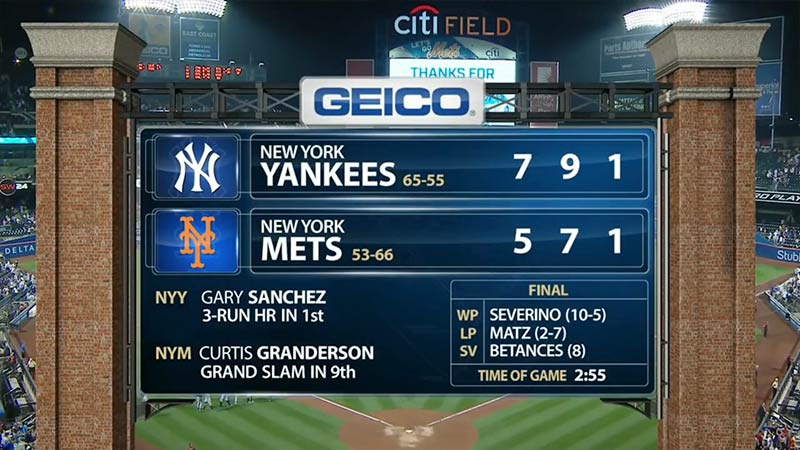
- Scoreline: Located at the top of the scoreboard, it displays the total runs scored by each team in each inning.
- Inning Display: This section shows the current inning being played, usually represented by a number from 1 to 9 (or more in case of extra innings).
- Outs and Strikes: The scoreboard indicates the number of outs made by each team and the number of strikes against the current batter.
- Score by Team: Alongside each team’s name or logo, you’ll find the team’s current score.
- Pitch Count: The pitch count denotes the number of pitches thrown by the pitcher, which can be helpful in understanding their endurance and potential fatigue.
- Ball-Strike Count: This section displays the current count of balls and strikes for the current batter. Four balls result in a walk, while three strikes lead to a strikeout.
- Batter and Pitcher Information: The scoreboard may feature the current batter’s name, jersey number, and statistics, along with the pitcher’s information, such as their name, jersey number, and pitch velocity.
Scoreboard Layout and Design
The layout and design of a baseball scoreboard can vary depending on the stadium and technological advancements. Traditional scoreboards consisted of manual score panels with numbers and letters that required someone to physically change them.
However, modern scoreboards have evolved significantly, incorporating advanced technologies such as LED displays, high-definition graphics, and video screens.
Typically, the layout of a scoreboard includes a central section that showcases the scoreline, inning, outs, strikes, and team scores. Surrounding this central section, you may find additional information, such as player statistics, upcoming batters, and pitching changes.
Scoreboards often incorporate team logos, vibrant colors, and eye-catching graphics to enhance the visual appeal and engagement of the fans.
Key Terminology in the Scoreboard
To fully comprehend the information displayed on a baseball scoreboard, it’s essential to familiarize yourself with key baseball terminology:
- Innings: A baseball game consists of nine innings, with each team having a chance to bat and field for an inning. In the case of a tie, extra innings are played until there is a winner.
- Runs: Runs represent the number of times a team successfully crosses home plate, earning them a point. The team with the most runs at the end of the game wins.
- Hits: Hits refer to the number of successful contacts made by batters against the opposing team’s pitches. A hit occurs when the batter safely reaches a base without any defensive errors.
- Errors: Errors are defensive mistakes committed by players that allow the opposing team to reach base or advance further than they would have under normal circumstances. Errors can negatively impact a team’s performance and can be displayed on the scoreboard.
In-Game Information of Baseball Scoreboard
The scoreline on a baseball scoreboard provides a chronological breakdown of runs scored by each team in each inning. It helps track the game’s progress and reveals scoring patterns throughout the match.
Each inning has its own designated box, and the score is updated accordingly after each team has completed its offensive half of the inning.
For example, if the home team scores 2 runs in the first inning and the visiting team scores 1 run, the scoreline would display:
- Inning: 1 2 3 4 5 6 7 8 9
- Home: 2
- Visitor: 1
Inning Display and Sequence

The inning display on the scoreboard indicates the current inning being played. In professional baseball, a standard game consists of nine innings. However, if the game is tied after nine innings, extra innings are played until there is a winner.
The inning display typically features a number from 1 to 9, often represented by individual illuminated panels or digital numbers. As the game progresses, the inning number is updated accordingly. In the case of extra innings, additional numbers or indicators are used to represent the ongoing extra frames.
Outs and Strikes
The outs and strikes sections of the scoreboard provide crucial information about the current state of the game.
Each team gets three outs per inning, which occur when the defensive team successfully retires three batters. The outs are typically represented by illuminated circles or squares that are filled in to indicate each out.
Strikes indicate the number of times a pitcher has successfully thrown the ball in the strike zone without the batter making contact. If the batter accumulates three strikes, they are called out, resulting in a strikeout.
The strike count is often displayed using two illuminated panels, with the left panel representing balls and the right panel representing strikes.
Score by Team
The score by team section displays the total runs scored by each team throughout the game. It allows fans to track the overall performance and compare the scores of both teams. The scores are updated after each run is scored and are typically presented alongside the team’s name or logo.
The score by team section may also include additional information such as the number of hits or errors committed by each team. This provides a more detailed overview of the game and helps fans understand the team’s offensive and defensive capabilities.
Pitch Count and Ball-Strike Count
The pitch count and ball-strike count sections of the scoreboard provide valuable insights into the ongoing battle between the pitcher and the batter.
The pitch count represents the number of pitches thrown by the pitcher during the game. It helps gauge the pitcher’s endurance and the potential need for a pitching change. A high pitch count can indicate a tired pitcher or a challenging matchup.
The ball-strike count reveals the current count of balls and strikes for the current batter. A ball is called when the pitcher throws a pitch outside the strike zone and the batter does not swing.
Four balls result in a walk, allowing the batter to advance to first base. Strikes, on the other hand, are called when the pitcher throws a pitch within the strike zone, and the batter either swings and misses or does not swing at all. Three strikes result in a strikeout, and the batter is retired.
Batter and Pitcher Information
The scoreboard often features information about the current batter and pitcher. This can include their names, jersey numbers, and sometimes even their batting or pitching statistics.
Displaying this information allows fans to keep track of individual player performances and provides context for their current at-bat or pitching appearance.
The scoreboard may display the name and jersey number of the current batter, allowing fans to identify the player stepping up to the plate. Some scoreboards might also provide additional statistics such as the batter’s batting average, home runs, or RBIs (Runs Batted In).
Additional Statistics to Read Baseball Scoreboard
Baseball is a sport rich in statistics, and a baseball scoreboard often provides additional information beyond the basic scoreline and inning display. These statistics offer valuable insights into the performance of teams and individual players.
In this section, we will explore some of the key statistics commonly featured on a baseball scoreboard.
Batting Average (BA)
Batting Average (BA) is one of the most fundamental statistics in baseball and provides a measure of a batter’s success at the plate. It is calculated by dividing the number of hits by the total number of at-bats.
The batting average is typically displayed as a three-digit decimal, such as .300 or .265. A batting average of .300 or higher is considered excellent, indicating that the batter successfully reaches base in approximately 30% of their at-bats.
On the scoreboard, a batter’s batting average may be accompanied by the number of hits they have accumulated in the game. This allows fans to see the immediate impact a batter is making and assess their current performance.
Earned Run Average (ERA)
Earned Run Average (ERA) is a crucial statistic for evaluating a pitcher’s effectiveness. It measures the average number of earned runs a pitcher allows per nine innings pitched.
The lower the ERA, the better the pitcher’s performance. An ERA is calculated by multiplying the number of earned runs given up by nine and dividing it by the number of innings pitched.
On the scoreboard, a pitcher’s ERA may be displayed alongside their name or jersey number. This allows fans to quickly assess the pitcher’s effectiveness and compare it to other pitchers in the game or the league as a whole.
On-Base Percentage (OBP)
On-base percentage (OBP) measures a batter’s ability to reach base safely. It takes into account not only hits but also walks and times hit by a pitch. OBP is calculated by dividing the sum of hits, walks, and hit-by-pitchs by the sum of at-bats, walks, hit-by-pitch, and sacrifice flies.
It is typically displayed as a three-digit decimal, such as .360 or .420. A higher on-base percentage indicates a batter’s effectiveness in getting on base and putting pressure on the opposing team’s defense.
On the scoreboard, a batter’s OBP may be shown alongside their other statistics, providing a more comprehensive view of their offensive contributions.
Slugging Percentage (SLG)
Slugging Percentage (SLG) is a statistic that measures a batter’s power at the plate. It calculates the total number of bases a batter earns per at-bat. The formula for SLG involves dividing the total bases (singles, doubles, triples, and home runs) by the total number of at-bats.
SLG is typically displayed as a three-digit decimal, such as .500 or .600. A higher slugging percentage indicates a batter’s ability to hit for extra bases and drive in runs.
On the scoreboard, a batter’s slugging percentage may be displayed alongside their other offensive statistics. This helps fans assess the batter’s power and impact on the game.
Fielding Percentage (FPCT)
Fielding Percentage (FPCT) is a statistic used to measure a player’s defensive abilities. It calculates the percentage of plays a fielder successfully completes without making an error.
The formula for FPCT involves dividing the total number of successful fielding plays by the total number of chances (successful plays plus errors). FPCT is typically displayed as a three-digit decimal, such as .980 or .925. A higher fielding percentage indicates a more reliable and proficient fielder.
On the scoreboard, a fielder’s FPCT may be displayed alongside their name or jersey number. This provides fans with insight into the fielder’s defensive prowess and reliability.
Other Advanced Statistics
Beyond the basic statistics mentioned above, there are numerous advanced statistics in baseball that provide deeper insights into player and team performance. While these statistics may not always be displayed on the scoreboard, they play a significant role in evaluating players and teams.
- OPS (On-Base Plus Slugging): OPS combines a player’s on-base percentage and slugging percentage to provide a comprehensive measure of their offensive production.
- WAR (Wins Above Replacement): WAR attempts to quantify a player’s total contributions to their team in comparison to a hypothetical replacement-level player.
- FIP (Fielding Independent Pitching): FIP measures a pitcher’s performance based on factors they can control (such as strikeouts, walks, and home runs) while excluding factors influenced by fielders.
- wRC+ (Weighted Runs Created Plus): wRC+ takes into account a batter’s total offensive contributions, adjusting for ballpark factors and the league average.
FAQs
How do I interpret the numbers and abbreviations on a baseball scoreboard?
Reading a baseball scoreboard may seem confusing at first, but with a little guidance, it becomes easier. The numbers on the scoreline represent the runs scored by each team in each inning. The inning display shows the current inning being played.
The outs and strikes sections indicate the number of outs made and the count on the batter. The score by team section displays the total runs scored by each team. Additional statistics like batting average, ERA, on-base percentage, slugging percentage, and fielding percentage may also be included.
What does the pitch count and ball-strike count mean on the scoreboard?
The pitch count shows the number of pitches thrown by the pitcher during the game, giving an idea of their endurance and potential fatigue. The ball-strike count represents the current count of balls and strikes for the batter.
Four balls result in a walk, while three strikes lead to a strikeout. The count is typically displayed using illuminated panels, with the left panel representing balls and the right panel representing strikes.
Can you explain the significance of batting average and slugging percentage?
Batting average (BA) measures a batter’s success at the plate by dividing the number of hits by the total number of at-bats. It provides an indication of their ability to get on base.
Slugging percentage (SLG) measures a batter’s power by calculating the total number of bases earned per at-bat. A higher slugging percentage indicates the ability to hit for extra bases. Both batting average and slugging percentage are displayed as three-digit decimals on the scoreboard.
How can I understand the pitcher’s performance through the scoreboard?
The scoreboard often displays the pitcher’s ERA (Earned Run Average), which represents the average number of earned runs they allow per nine innings pitched. A lower ERA indicates a more effective pitcher.
Additionally, the pitch count helps gauge a pitcher’s endurance and potential need for a pitching change. By tracking these numbers, you can assess the pitcher’s effectiveness and compare their performance to other pitchers.
Are there any other advanced statistics I should pay attention to on the scoreboard?
While not always displayed on the scoreboard, there are several advanced statistics that provide deeper insights into player and team performance.
Some notable examples include OPS (On-Base Plus Slugging), WAR (Wins Above Replacement), FIP (Fielding Independent Pitching), and wRC+ (Weighted Runs Created Plus).
Bottom Line
Reading a baseball scoreboard is an art form that takes time to master. With this blog post as your guide, you are now equipped with the knowledge to decipher the numbers, abbreviations, and statistics that grace digital displays in ballparks around the world.
Whether you’re a die-hard fan attending a game in person or following along from the comfort of your home, understanding the scoreboard adds a whole new dimension to your baseball experience.
So, next time you find yourself in the stands or tuning in to a broadcast, take a moment to glance up at the scoreboard and let the numbers tell you the story of the game. May your love for baseball grow stronger with every inning, and may you always have a clear understanding of the game unfolding before your eyes. Play ball!