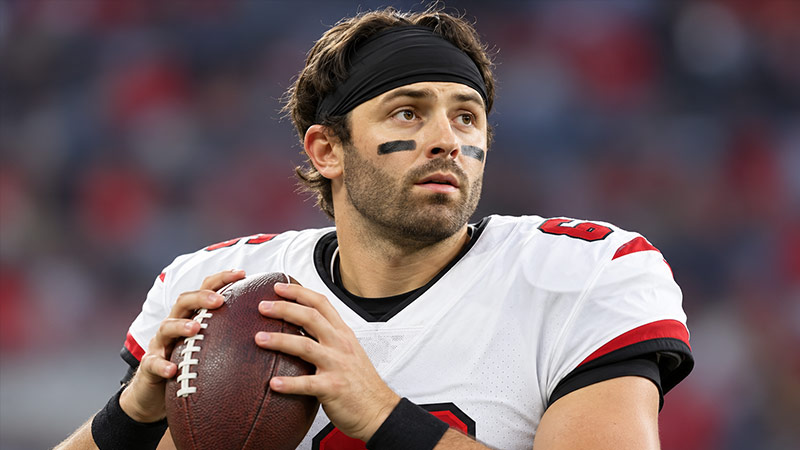
Understanding the trajectory of an NFL quarterback requires evaluating both raw statistical output and context.
Selected No. 1 overall in the 2018 NFL Draft out of Oklahoma by the Cleveland Browns, Baker Mayfield has developed one of the most dynamic career profiles among active NFL passing leaders.
Standing 6 feet 1 inch tall and weighing 215 pounds, the 31-year-old quarterback currently wears number 6 for the Tampa Bay Buccaneers.
Across 126 career regular season games, Mayfield has compiled 2,561 completions on 4,034 attempts (63.5% completion rate), 29,140 passing yards, 199 passing touchdowns, and 103 interceptions, alongside a career passer rating of 90.9.
His path through four NFL organizations—the Cleveland Browns, Carolina Panthers, Los Angeles Rams, and Tampa Bay Buccaneers—provides clear insight into quarterback development, scheme adaptability, and performance volatility under varying system conditions.
The Cleveland Era & Multi-Team Transition (2018–2022)
| Season | Organization | GP | CMP / ATT | CMP% | YDS | YPA | TD | INT | SACK | RTG | QBR |
|---|---|---|---|---|---|---|---|---|---|---|---|
| 2018 | CLE | 14 | 310 / 486 | 63.8% | 3,725 | 7.7 | 27 | 14 | 25 | 93.7 | 51.2 |
| 2019 | CLE | 16 | 317 / 534 | 59.4% | 3,827 | 7.2 | 22 | 21 | 40 | 78.8 | 54.4 |
| 2020 | CLE | 16 | 305 / 486 | 62.8% | 3,563 | 7.3 | 26 | 8 | 26 | 95.9 | 65.5 |
| 2021 | CLE | 14 | 253 / 418 | 60.5% | 3,010 | 7.2 | 17 | 13 | 43 | 83.1 | 40.9 |
| 2022 | CAR | 7 | 119 / 206 | 57.8% | 1,313 | 6.4 | 6 | 6 | 19 | 74.4 | 26.3 |
| 2022 | LAR | 5 | 82 / 129 | 63.6% | 850 | 6.6 | 4 | 2 | 17 | 86.4 | 26.3 |
| 2022 Total | Combined | 12 | 201 / 335 | 60.0% | 2,163 | 6.5 | 10 | 8 | 36 | 79.0 | 26.3 |
In 2022, Mayfield navigated a split-season structure across two organizations. Across 7 games with the Carolina Panthers, he recorded 119 completions on 206 attempts (57.8%) for 1,313 yards, 6 touchdowns, and 6 interceptions.
After transitioning to the Los Angeles Rams for 5 games, his accuracy rose to 63.6% (82 for 129) for 850 yards, 4 touchdowns, and 2 interceptions.
His combined 2022 line concluded with 2,163 passing yards, 10 touchdowns, 8 interceptions, and 36 sacks over 12 games.
The Tampa Bay Resurgence (2023–2025)
| Season | Organization | GP | CMP / ATT | CMP% | YDS | YPA | TD | INT | SACK | RTG | QBR |
|---|---|---|---|---|---|---|---|---|---|---|---|
| 2023 | TB | 17 | 364 / 566 | 64.3% | 4,044 | 7.1 | 28 | 10 | 40 | 94.6 | 55.1 |
| 2024 | TB | 17 | 407 / 570 | 71.4% | 4,500 | 7.9 | 41 | 16 | 40 | 106.8 | 58.4 |
| 2025 | TB | 17 | 343 / 543 | 63.2% | 3,693 | 6.8 | 26 | 11 | 36 | 90.6 | 61.3 |
Over these three years in Tampa Bay (2023–2025), Mayfield missed zero games, totaling 12,237 passing yards and 95 passing touchdowns.
2026 Status Check & NFC South Team Context
Tampa Bay currently struggles in team standings, holding a 1–4–0 record (.200 winning percentage), having scored 100 points while conceding 112 points.
| NFC South Team | Wins | Losses | Ties | PCT | Points For (PF) | Points Against (PA) |
|---|---|---|---|---|---|---|
| Carolina Panthers | 2 | 2 | 0 | .500 | 121 | 109 |
| Atlanta Falcons | 2 | 3 | 0 | .400 | 119 | 122 |
| Tampa Bay Buccaneers | 1 | 4 | 0 | .200 | 100 | 112 |
| New Orleans Saints | 1 | 4 | 0 | .200 | 118 | 151 |
Media discussions around Tampa Bay’s 1–4 start have focused on questions regarding offensive structural identity and evaluations comparing Mayfield against other NFC South starting quarterbacks.
Complete Career Benchmark Breakdown
Evaluating Mayfield’s complete statistical footprint across 126 games highlights his durable career production, extending beyond passing volume to include rushing contribution and scoring efficiency.
1. Lifetime Passing Benchmark Summary
- Games Played: 126
- Completions: 2,561
- Pass Attempts: 4,034
- Completion Percentage: 63.5%
- Passing Yards: 29,140
- Yards Per Attempt (YPA): 7.2
- Touchdown Passes: 199
- Interceptions: 103
- Longest Pass: 89 yards
- Total Sacks Taken: 299
- Career Passer Rating: 90.9
2. Lifetime Rushing & Mobility Metrics
- Rushing Carries: 377
- Rushing Yards: 1,648
- Yards Per Carry Average: 4.4
- Rushing Touchdowns: 12
- Longest Rush: 35 yards
- Rushing First Downs: 132
- Total Fumbles: 31
- Fumbles Lost: 5
3. Career Scoring Output
- Passing Touchdowns: 199
- Rushing Touchdowns: 12
- Two-Point Conversions: 12
- Individual Points Scored: 74
| Category | Career Totals (126 Games) | Per Game Average / Benchmark Rate |
|---|---|---|
| Passing Volume | 2,561 / 4,034 (29,140 Yards) | 231.3 Passing Yards / Game |
| Touchdown-to-Interception Ratio | 199 TD / 103 INT | 1.93 TD per INT |
| Rushing Contribution | 377 Carries / 1,648 Yards / 12 TD | 4.4 Yards / Carry |
| Ball Security (Fumbles) | 31 Fumbles (5 Lost) | 0.04 Lost Fumbles / Game |
| Pass Protection Sacks | 299 Sacks Absorbed | 2.37 Sacks / Game |
Strategic Outlook & Key Takeaways
Baker Mayfield’s career profile reflects adaptable starting quarterbacking across multiple system schemes.
After transitioning out of Cleveland and managing the multi-team split of 2022, his peak performance in Tampa Bay demonstrated top-tier efficiency when supported by target continuity.
To re-establish offensive momentum during the 2026 season, Tampa Bay must address several operational factors:
- Health Recovery: Restoring Mayfield from his current OUT status remains the primary priority for offensive stability.
- Pass Protection Adjustment: Mitigating sack frequency is essential, as Mayfield has taken 299 career sacks, including 13 sacks across just 3 games in 2026.
- Division Standings Recovery: Overcoming a 1–4 start will require elevating offensive efficiency to move up from third place in the NFC South.
When healthy and working in rhythm, Mayfield’s career benchmarks—29,140 passing yards, 199 passing touchdowns, and a 63.5% completion rate—confirm his standing as a capable starter in the modern NFL.