In the modern landscape of professional football, evaluating receiver performance has transitioned from simple aggregate yardage totals to a deep study of target optimization, schematic shifts, and workload efficiency.
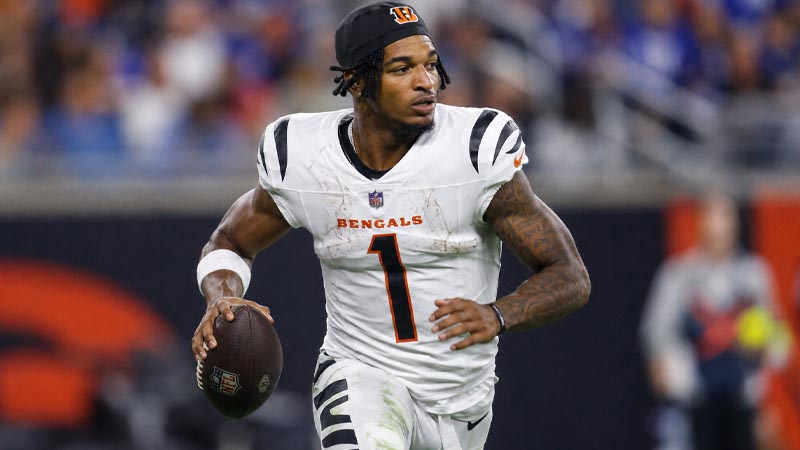
Since entering the league as the fifth overall selection in the first round of the 2021 draft, wide receiver Ja’Marr Chase has established himself as one of the premier offensive weapons in professional sports.
While popular narratives often focus on his highlight-reel touchdowns and game-breaking speed, the underlying mathematical progression of his five-year career reveals a far more complex story.
Chase has evolved from a pure vertical threat into an elite, high-volume possession and yardage engine. This exhaustive statistical profile dissects his year-by-year performance metrics, tracking his strategic utilization, target-to-reception transformation, and overall value.
The Baseline Career Blueprint
To understand the trajectory of Ja’Marr Chase’s career, we must first look at his raw regular-season production.
Over his first 78 regular-season appearances, Chase has accumulated 520 receptions on 767 targets, translating to 6,837 yards and 54 touchdowns.
Below is the complete, high-definition regular-season receiving dataset charting his year-by-year output.
Ja’Marr Chase Career Receiving Metrics (2021–2025)
| Season | Team | Games Played (GP) | Receptions (REC) | Targets (TGTS) | Receiving Yards (YDS) | Average Yards/Catch (AVG) | Touchdowns (TD) | Longest Catch (LNG) | First Downs (FD) | Fumbles (FUM) | Fumbles Lost (LST) |
|---|---|---|---|---|---|---|---|---|---|---|---|
| 2021 | CIN | 17 | 81 | 128 | 1,455 | 18.0 | 13 | 82 | 56 | 2 | 1 |
| 2022 | CIN | 12 | 87 | 134 | 1,046 | 12.0 | 9 | 60 | 58 | 2 | 2 |
| 2023 | CIN | 16 | 100 | 145 | 1,216 | 12.2 | 7 | 76 | 63 | 1 | 0 |
| 2024 | CIN | 17 | 127 | 175 | 1,708 | 13.4 | 17 | 70 | 75 | 0 | 0 |
| 2025 | CIN | 16 | 125 | 185 | 1,412 | 11.3 | 8 | 64 | 73 | 1 | 1 |
| Career | CIN | 78 | 520 | 767 | 6,837 | 13.1 | 54 | 82 | 325 | 6 | 4 |
In his rookie campaign (2021), Chase operated primarily as a vertical stretcher, averaging a career-high 18.0 yards per reception. Opposing defensive coordinators quickly realized that allowing Chase to roam free in the deep thirds of the field was catastrophic.
Consequently, defenses adjusted by deploying deeper coverages, forcing the Cincinnati passing game to adapt.
This adjustment is reflected in his 2025 statistics, where his average yards per catch fell to a career-low 11.3 yards, yet he managed to haul in a near-career-high 125 receptions on a massive 185 targets.
Year-by-Year Tactical Progression
1. The Rookie Launchpad (2021)
Chase’s rookie year remains one of the most efficient vertical seasons in modern league history. Catching 81 passes for 1,455 yards, his 18.0 yards per catch demonstrated a rare ability to generate yards after the catch and separate downfield.
He scored 13 touchdowns and converted 56 first downs, proving that his collegiate chemistry with quarterback Joe Burrow translated to the professional stage.
2. The Sophomore Adjustment (2022)
Injury limited Chase to 12 games in his second season. Despite this limited window, he was targeted 134 times, converting them into 87 receptions.
This year marked the beginning of his role change, as his yards-per-reception average fell sharply from 18.0 to 12.0. Rather than acting purely as a deep threat, he became a critical possession asset, moving the chains for 58 first downs.
3. Volume Standardization (2023)
In 2023, Chase crossed the 100-reception threshold for the first time. Over 16 games, he caught 100 of his 145 targets, totaling 1,216 yards and 7 touchdowns.
His yards-per-catch average stabilized at 12.2, showcasing his consistency in intermediate routes and screen designs.
4. The Apex Campaign (2024)
The 2024 season represents Chase’s statistical peak across multiple categories. Playing in all 17 games, he recorded career-highs in receiving yards (1,708) and touchdowns (17) while matching his physical style with elite playmaking.
Crucially, he did not commit a single fumble throughout the entire campaign, proving his value as a secure, high-workload weapon.
5. High-Density Target Reliance (2025)
The 2025 regular season cemented Chase’s transformation into a true offensive focal point. Ranking 3rd in the league in receptions (125) and 4th in receiving yards (1,412), he was targeted an extraordinary 185 times.
While his average yards per catch dipped to 11.3, his reliability as a chain-mover was critical, generating 73 first downs and accounting for 8 touchdowns.
Workload, Efficiency, and Rate Metrics
Evaluating raw totals can sometimes mask game-by-game efficiency. To fully understand his impact, we must convert these numbers into rate metrics, charting targets per game, receptions per game, and catch-to-target conversion ratios.
Ja’Marr Chase Workload and Target Efficiency Rates
| Season | Targets / Game | Receptions / Game | Catch Rate (%) | Yards / Game | First Downs / Game | Target Share Efficiency |
|---|---|---|---|---|---|---|
| 2021 | 7.53 | 4.76 | 63.28% | 85.59 | 3.29 | High-efficiency deep threat |
| 2022 | 11.17 | 7.25 | 64.93% | 87.17 | 4.83 | Heavy-volume pivot |
| 2023 | 9.06 | 6.25 | 68.97% | 76.00 | 3.94 | Intermediate chain-mover |
| 2024 | 10.29 | 7.47 | 72.57% | 100.47 | 4.41 | Triple-crown contender performance |
| 2025 | 11.56 | 7.81 | 67.57% | 88.25 | 4.56 | Offensive focus, high-density target share |
| Career | 9.83 | 6.67 | 67.80% | 87.65 | 4.17 | Consistently Elite |
Analysis of Table 2: Calculating his usage on a per-game basis highlights his importance to the Cincinnati scheme.
In 2021, Chase needed only 7.53 targets per game to generate 85.59 yards. By 2025, his volume surged to 11.56 targets per game, while his output remained incredibly consistent at 88.25 yards per game.
His career catch rate of 67.80% is particularly impressive for an outside receiver who is regularly subjected to double coverages, bracketed safeties, and physical press alignments.
This high conversion efficiency explains why the coaching staff consistently structures high-volume passing game plans around his skill set.
Versatility, Ball Security, and Supplementary Contributions
To appreciate Chase’s complete profile, we must look beyond his standard receiving statistics. Elite offensive weapon design often requires utilizing primary playmakers in creative ways, including backfield alignments and option packages.
Additionally, ball security and defensive hustle following turnovers are critical markers of a player’s real-world value.
Ja’Marr Chase Rushing and Utility Statistics
| Season | Games Played (GP) | Carries (CAR) | Rushing Yards (YDS) | Average Yards/Carry (AVG) | Rushing TD | Longest Run (LNG) | Rushing First Downs (FD) |
|---|---|---|---|---|---|---|---|
| 2021 | 17 | 7 | 21 | 3.0 | 0 | 10 | 2 |
| 2022 | 12 | 5 | 8 | 1.6 | 0 | 6 | 0 |
| 2023 | 16 | 3 | -6 | -2.0 | 0 | 2 | 0 |
| 2024 | 17 | 3 | 32 | 10.7 | 0 | 14 | 2 |
| 2025 | 16 | 3 | 14 | 4.7 | 0 | 9 | 0 |
| Career | 78 | 21 | 69 | 3.3 | 0 | 14 | 4 |
While Chase is not a frequent ball carrier out of the backfield, his 21 career rushes for 69 yards show his versatility. He is occasionally utilized on jet sweeps, end-arounds, and touch-passes designed to leverage his blocking in space. His 10.7 yards per carry in 2024 shows how these tactical wrinkles can catch defenses off guard.
Ball Security and Defensive Intervention Metrics
| Season | Fumbles | Fumbles Lost | Total Defensive Tackles | Solo Tackles | Assisted Tackles | Pass Deflections / Interventions |
|---|---|---|---|---|---|---|
| 2021 | 2 | 1 | 3 | 2 | 1 | Hustle tackles on turnovers |
| 2022 | 2 | 2 | 4 | 4 | 0 | Hustle tackles on turnovers |
| 2023 | 1 | 0 | 2 | 2 | 0 | Hustle tackles on turnovers |
| 2024 | 0 | 0 | 6 | 6 | 0 | Hustle tackles on turnovers |
| 2025 | 1 | 1 | 5 | 5 | 0 | Hustle tackles on turnovers |
| Career | 6 | 4 | 20 | 19 | 1 | Outstanding Effort Play |
In 78 regular-season games, Chase has put the ball on the ground only 6 times, losing 4. For a player who has handled the ball 541 times (520 receptions plus 21 carries), this represents a fumble rate of just 1.11%.
Furthermore, his defensive statistics reveal an admirable hustle element. With 20 career total tackles (19 solo), Chase actively pursues opposing defenders on the rare occasions Burrow throws an interception, preventing defensive touchdowns and saving crucial points.
Red Zone Efficiency and Scoring Impact
A primary metric separating elite tier-one receivers from secondary pieces is their ability to convert opportunities in the red zone. Chase is a master of end-zone conversion, scoring 54 receiving touchdowns in 78 games.
Scoring and Value Profile
| Season | Receiving TDs | Rushing TDs | Total TDs | 2-Point Conversions | Total Points Scored | Fantasy Football Context (Field Yates) |
|---|---|---|---|---|---|---|
| 2021 | 13 | 0 | 13 | 0 | 78 | Breakout rookie sensation |
| 2022 | 9 | 0 | 9 | 0 | 54 | High-floor weekly starter |
| 2023 | 7 | 0 | 7 | 0 | 42 | High-volume WR1 option |
| 2024 | 17 | 0 | 17 | 0 | 102 | Tier 1 overall fantasy asset |
| 2025 | 8 | 0 | 8 | 0 | 48 | Heavy-volume PPR floor champion |
| Career | 54 | 0 | 54 | 0 | 324 | Consistently valued in the Top 5 |
With 324 career points scored, Chase has averaged 4.15 points per game purely from touchdown production.
This consistent scoring ability is why prominent fantasy football analysts like Field Yates rank Chase as their 4th overall draft pick.
In points-per-reception (PPR) formats, Chase’s combination of high-density target volume (185 targets in 2025) and touchdown upside creates an incredibly high weekly floor and winning upside.
Real-World Team Impact: The 2026 Campaign
Individual stats are most valuable when they lead to team success. As of the current 2026 campaign, the Cincinnati Bengals are capitalizing on Chase’s dominance, starting the season with a perfect 3-0 record to lead a highly competitive AFC North division.
2026 AFC North Comparative Standings
| Team | Wins (W) | Losses (L) | Ties (T) | Winning Percentage (PCT) | Points For (PF) | Points Against (PA) | Division Status |
|---|---|---|---|---|---|---|---|
| Cincinnati | 3 | 0 | 0 | 1.000 | 73 | 36 | Tied for 1st |
| Baltimore | 3 | 0 | 0 | 1.000 | 78 | 13 | Tied for 1st |
| Cleveland | 1 | 2 | 0 | .333 | 54 | 78 | 3rd |
| Pittsburgh | 1 | 2 | 0 | .333 | 55 | 54 | 4th |
The Bengals’ offense has generated 73 points over their first three games, averaging a healthy 24.3 points per contest. With Baltimore also matching them at 3-0, every game on the 2026 schedule is critical.
Cincinnati’s upcoming home matchup against the Tampa Bay Buccaneers at Paycor Stadium on September 13, 2026, will rely heavily on Chase to stretch the field, beat press coverage, and keep the chain-moving engine on schedule.
Conclusion: The Path Ahead
Ja’Marr Chase’s statistical resume through 78 career games places him among the elite players in modern football.
His versatility to adapt from a big-play rookie to a high-volume target earner shows both his intelligence and physical durability.
As the Bengals push for division supremacy in the 2026 season, expect Chase to remain the primary engine of this offense, turning targets into wins.