
In the ever-evolving world of baseball analytics, advanced statistics have become integral in evaluating player performance. One such statistic that has gained prominence is wOBA or Weighted On-Base Average.
Unlike traditional statistics like batting average (BA) or on-base percentage (OBP), wOBA provides a more comprehensive and nuanced measure of a player’s offensive capabilities.
By taking into account the specific value of each offensive event and assigning appropriate weights, wOBA aims to offer a more accurate assessment of a player’s offensive contributions.
In this article, we will delve into what exactly wOBA is, how it differs from traditional statistics, the process of calculating it, and its significance in modern baseball analysis. So, stay tuned.
What Is WOBA in Baseball?
In the ever-evolving world of baseball analytics, advanced statistics have gained significant importance in evaluating player performance. One such metric that has revolutionized the assessment of offensive prowess is wOBA, or Weighted On-Base Average.
Unlike traditional statistics such as batting average (BA) or on-base percentage (OBP), wOBA takes into account the specific value of each offensive event. Let’s dive deeper into understanding wOBA and its significance in modern baseball analysis.
Significance of wOBA
wOBA can be defined as a comprehensive statistic that measures a player’s offensive contribution by assigning weights to various offensive events. These events include hits, walks, hit-by-pitches, and home runs.
By incorporating the run-scoring value of each event, wOBA provides a more accurate representation of a player’s offensive impact. It measures not only the ability to get on base but also the quality of each plate’s appearance in terms of generating runs.
The significance of wOBA lies in its ability to capture the true value of offensive production. Traditional statistics like batting average (BA) only consider the outcome of a plate appearance, disregarding the differences in run-scoring potential.
On the other hand, wOBA accounts for the relative worth of different events, thus offering a more nuanced assessment of a player’s offensive performance.
How Woba Differs From Traditional Statistics
wOBA differs from traditional statistics like batting average (BA) and on-base percentage (OBP) in several ways.
While BA focuses solely on hits and does not account for walks or other events, and OBP includes walks but ignores the specific value of different offensive events, wOBA addresses these limitations.
Unlike BA, wOBA considers not only hits but also walks, hit-by-pitches, and home runs, acknowledging their varying run-scoring values. This is crucial because a hit-by-pitch or a home run can have a more significant impact on run production than a mere single or double.
Similarly, wOBA surpasses OBP by assigning appropriate weights to each offensive event. While OBP treats all times on base equally, wOBA recognizes the difference between, for example, a walk and a home run.
The Concept of Assigning Weights to Offensive Events
The key concept behind wOBA is assigning weights to different offensive events based on their run-scoring value. These weights are determined through statistical analysis of historical baseball data.
For instance, a home run, being the most valuable offensive event, would receive the highest weight. On the other hand, a single or a walk would have lower weights but still contribute positively to a player’s wOBA.
By considering the specific value of each event, wOBA provides a more accurate assessment of offensive performance and enables fair comparisons across players.
wOBA offers a comprehensive and nuanced approach to evaluating offensive performance in baseball. By considering the run-scoring value of different offensive events and assigning appropriate weights, wOBA provides a more accurate measure of a player’s ability to generate runs.
It differs from traditional statistics like batting average and on-base percentage by accounting for the specific worth of each event. As baseball continues to embrace advanced analytics, wOBA has become an essential tool for teams and analysts in assessing player performance.
Components of wOBA
Check out the following components to dig deep into the concept of wOBA.
The Offensive Events Included in wOBA
wOBA takes into account various offensive events that contribute to a player’s overall performance. These events include hits, walks, hit-by-pitches, and home runs. Here’s a breakdown of each event:
Hits
Hits are categorized into singles, doubles, triples, and home runs. Each hit represents a different level of offensive success, with home runs being the most impactful in terms of generating runs.
Walks
Walks occur when a pitcher throws four pitches outside the strike zone, and the batter does not swing. A walk allows the batter to reach first base without putting the ball in play. While walks do not involve hitting the ball, they are valuable as they provide the team with an additional baserunner.
Hit-by-Pitches (HBP)
A hit-by-pitch occurs when a pitcher unintentionally hits the batter with a pitch. Similar to walks, being hit by a pitch grants the batter first base without needing to put the ball in play.
Home Runs
A home run is achieved when a batter hits the ball over the outfield fence. It is the most productive offensive event, resulting in an immediate run scored.
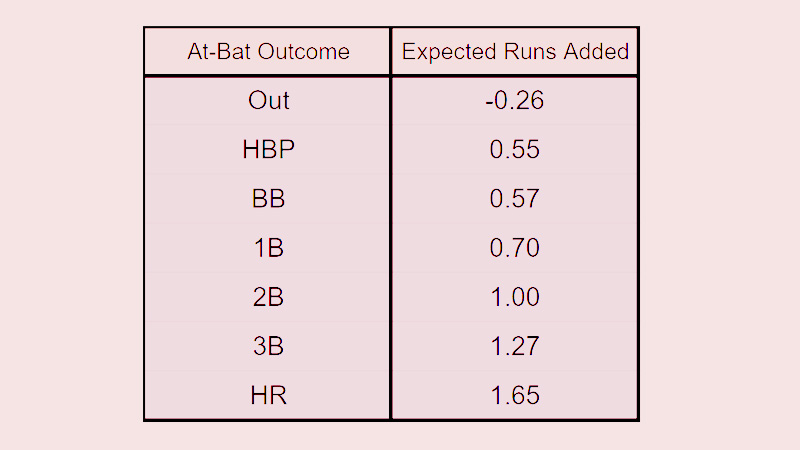
Assigning Observed Run Values to Each Offensive Event
To calculate wOBA accurately, each offensive event is assigned an observed run value. These run values represent the average number of runs produced by that particular event. The observed run values are derived from extensive statistical analysis of historical data.
For example, the observed run value for a single might be determined to be 0.884, while a double could have a value of 1.257. Triples might be assigned a run value of 1.593, and home runs could be assigned the highest value, such as 2.058.
Walks and hit-by-pitches also have their observed run values, albeit typically lower than hits or home runs.
Justification for Specific Run-Value Assignments
The assignment of observed run values to each offensive event in wOBA is based on empirical analysis. By examining historical data and analyzing the outcomes of various offensive events, statisticians can determine the average number of runs produced by each event.
The run values are justified through extensive research and validation, taking into account factors such as the frequency of occurrence and the impact on run scoring.
The goal is to assign appropriate weights that accurately reflect the run production potential of each offensive event. These weights aim to ensure that wOBA aligns with the actual value that each event brings to an offense.
It’s important to note that run value assignments may be subject to adjustments or refinements over time as more data becomes available and analytical techniques evolve.
Nevertheless, the assigned run values play a crucial role in calculating wOBA and providing a comprehensive measure of offensive performance.
The process of determining run values involves statistical analysis and justification based on historical data. By incorporating these components, wOBA provides a robust framework for evaluating offensive contributions and capturing the true value of different events in baseball.
Calculating wOBA
Calculating wOBA requires a systematic approach that combines relevant data and mathematical operations. By understanding the step-by-step process, we can gain insights into a player’s offensive performance.
Let’s explore the key components involved in calculating wOBA and how they contribute to this advanced statistic.
Gathering the Necessary Data for wOBA Calculation
To calculate wOBA accurately, you need specific data for each player. This data includes the number of hits, walks, hit-by-pitches, home runs, at-bats, intentional walks, sacrifices, and plate appearances.
These statistics can be obtained from various sources such as baseball databases, official game logs, or reliable statistical websites.
Having access to this data ensures the availability of the necessary information to compute wOBA and provides a comprehensive picture of a player’s offensive contributions.
Plate Appearances: Understanding the Inclusive Nature of the Statistic
Plate appearances play a fundamental role in wOBA calculation. A plate appearance encompasses a variety of events, including at-bats, walks, hit-by-pitches, sacrifices, and other cases where a player steps up to the plate.
It is a comprehensive measure that accounts for a player’s opportunities to contribute offensively.
By considering plate appearances instead of just at-bats, wOBA avoids penalizing players for drawing walks, being hit by pitches, or executing sacrifices, all of which contribute positively to a team’s offensive production.
This inclusive nature allows for a fair assessment of a player’s ability to reach base and create scoring opportunities.
Dividing Observed Run Values by Plate Appearances
Once you have the necessary data, the next step is to divide the observed run values for each offensive event by the player’s plate appearances. This calculation yields the rate at which each event occurs for that specific player.
Dividing by plate appearances normalizes the statistic and allows for a fair comparison among players with different amounts of playing time.
For example, if a player has 100 plate appearances and has accumulated observed run values of 10 for singles, 5 for walks, and 4 for home runs, you would divide each of these values by 100 to determine their respective rates per plate appearance.
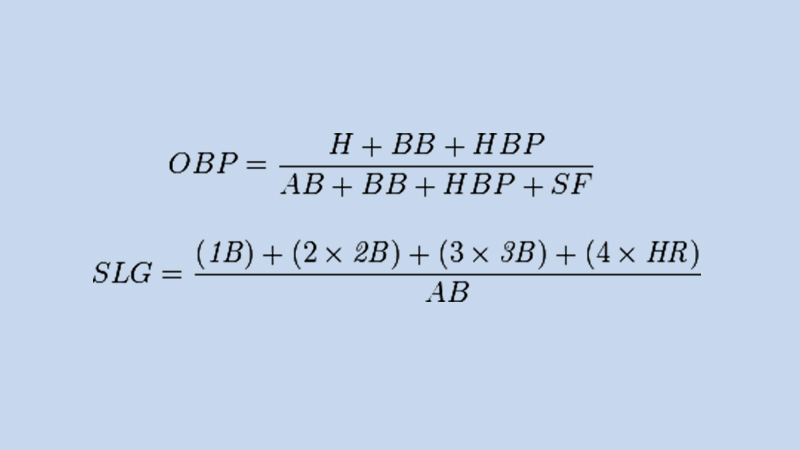
Scaling the Results to Match the Scale of OBP
To ensure consistency and facilitate interpretation, wOBA is scaled to match the scale of on-base percentage (OBP). OBP is expressed as a decimal between 0 and 1, representing the proportion of plate appearances that result in reaching the base.
To scale wOBA, the results obtained in the previous step are adjusted using a conversion factor. This factor is chosen so that the league-average wOBA matches the league-average OBP.
This scaling allows for an intuitive understanding of wOBA, with values ranging from 0 to 1. A higher wOBA signifies better offensive performance.
Calculating wOBA involves gathering the necessary data, understanding the inclusive nature of plate appearances, dividing observed run values by plate appearances, and scaling the results to match the scale of OBP.
This systematic approach allows for a comprehensive evaluation of a player’s offensive performance, providing a nuanced and valuable metric in modern baseball analysis.
Example Calculation
To understand the practical application of wOBA, it’s helpful to walk through an example calculation. By examining a sample player’s offensive statistics and performing the step-by-step calculations, we can gain insights into how wOBA is computed.
Also, we’ll explore how to interpret the resulting wOBA value and what it signifies in terms of the player’s offensive performance.
Walk-through of a Sample Player’s Offensive Statistics
Let’s consider a hypothetical player named Alex who has accumulated the following offensive statistics over the course of a season:
- Hits: 100 (including 80 singles, 15 doubles, and 5 triples)
- Walks: 50
- Hit-by-pitches: 10
- Home runs: 20
- At-bats: 300
- Intentional walks: 5
- Sacrifice flies: 3
- Plate appearances: 350
Step-by-step Calculation of wOBA Using the Formula
- To calculate wOBA, we can use the following formula:
wOBA = (0.691 × uBB + 0.722 × HBP + 0.884 × 1B + 1.257 × 2B + 1.593 × 3B + 2.058 × HR) / (AB + BB – IBB + SF + HBP) - Let’s substitute the values from Alex’s statistics into the formula:
wOBA = (0.691 × 45 + 0.722 × 10 + 0.884 × 80 + 1.257 × 15 + 1.593 × 5 + 2.058 × 20) / (300 + 50 – 5 + 3 + 10) - Simplifying the formula:
wOBA = (31.095 + 7.22 + 70.72 + 18.855 + 7.965 + 41.16) / 358
wOBA = 176.015 / 358
wOBA ≈ 0.491 (rounded to three decimal places)
Interpreting the Resulting wOBA Value
The resulting wOBA value for Alex is approximately 0.491. Interpreting this value, we can understand that Alex’s offensive performance, as measured by wOBA, is significantly above average.
Since wOBA is scaled to match the scale of on-base percentage (OBP), we can compare this value to OBP to gain further insight.
For context, a league-average OBP typically falls around 0.320 to 0.330. With Alex’s wOBA of 0.491, it suggests that he has been an exceptionally productive offensive player, consistently getting on base and contributing to run scoring at a high level.
Interpreting wOBA values requires context, as higher values indicate greater offensive performance relative to other players.
Through a walk-through of a sample player’s offensive statistics, step-by-step calculations using the wOBA formula, and interpreting the resulting value, we gain practical insights into the application and interpretation of wOBA.
This example showcases how wOBA provides a comprehensive measure of offensive performance and highlights the significance of a high wOBA value in indicating a player’s above-average productivity at the plate.
Advantages and Limitations of wOBA
wOBA has gained widespread recognition as an advanced statistic that provides a comprehensive evaluation of a player’s offensive performance. It offers several advantages over traditional metrics and contributes to a more accurate assessment of a player’s contributions at the plate.
However, it is important to acknowledge and consider the limitations and potential challenges associated with interpreting wOBA. Let’s explore the advantages and limitations of using wOBA for player evaluation.
Benefits of Using Woba for Player Evaluation
wOBA offers several key benefits when it comes to evaluating a player’s offensive performance:
Comprehensive Assessment
By incorporating various offensive events and assigning appropriate weights, wOBA provides a more complete picture of a player’s offensive contributions. It takes into account hits, walks, hit-by-pitches, and home runs, enabling a holistic evaluation of a player’s ability to generate runs.
Weighted Values
Unlike traditional statistics such as batting average or on-base percentage, wOBA assigns specific weights to each offensive event based on its impact on run scoring. This allows for a more accurate representation of a player’s offensive value, acknowledging the varying contributions of different events.
Contextual Comparisons
wOBA enables fair comparisons between players, regardless of their playing time or offensive approach. By considering plate appearances instead of simply at-bats, wOBA accounts for factors like walks and sacrifices, providing a level playing field for evaluation.
Improved Accuracy in Measuring Offensive Contributions
wOBA enhances the accuracy of measuring offensive contributions in several ways:
Run-Scoring Value
By assigning observed run values to each offensive event, wOBA captures the true value of these events in terms of run production. This provides a more precise assessment of a player’s ability to generate runs and contribute to the team’s offense.
Contextual Weights
The weights assigned to offensive events in wOBA reflect their actual impact on scoring runs. This acknowledges that not all hits or walks are created equal. For example, a home run has a higher weight than a single, reflecting its greater potential to drive in runs.
Statistical Validity
The calculation of wOBA is based on extensive statistical analysis and research. The observed run values are derived from historical data, ensuring a solid foundation for evaluating offensive performance.
Potential Limitations or Considerations When Interpreting wOBA
While wOBA is a valuable tool, it is essential to consider its limitations and potential challenges:
Contextual Factors
wOBA focuses solely on offensive performance and does not account for other aspects of the game, such as defensive contributions or baserunning abilities. It is important to incorporate a holistic evaluation when assessing a player’s overall value.
Evolving Run Values
The observed run values used in wOBA calculation may change over time as new data and research become available. Therefore, it is crucial to stay updated with the latest adjustments to ensure the accuracy of comparisons across different seasons or eras.
Individual Player Context
While wOBA allows for fair player comparisons, it is essential to consider the context of each player’s performance, such as ballpark factors, lineup position, or league norms.
These contextual factors can impact a player’s wOBA and should be taken into account when interpreting the statistic.
wOBA offers numerous advantages in evaluating a player’s offensive performance, providing a comprehensive and accurate assessment of their contributions at the plate.
However, it is important to be aware of the limitations and potential challenges associated with interpreting wOBA, including contextual factors and evolving run values.
wOBA in Practice
wOBA has gained significant traction in the world of baseball analytics, with teams and analysts increasingly adopting this advanced statistic to evaluate offensive performance.
Its integration into player evaluation and scouting has provided valuable insights and influenced decision-making. Let’s explore how wOBA is put into practice and examine examples of players with high and low wOBA values.
Adoption of wOBA by Teams and Analysts
Teams and analysts have recognized the value of wOBA in assessing offensive performance. Many Major League Baseball (MLB) teams have incorporated wOBA into their analytics departments and decision-making processes.
By utilizing wOBA, teams can better understand a player’s offensive contributions and make informed decisions regarding player acquisitions, lineup construction, and in-game strategies.
Baseball analysts and researchers utilize wOBA in their studies and publications. Its widespread adoption and acceptance within the baseball community highlight the significance and effectiveness of this advanced statistic.
Integration of wOBA Into Player Evaluation and Scouting
wOBA has become an integral part of player evaluation and scouting processes. By incorporating wOBA, teams can gain a deeper understanding of a player’s offensive abilities beyond traditional statistics like batting averages or home runs.
Scouts and evaluators consider a player’s wOBA when assessing their potential value and impact at the plate. It provides insights into a player’s ability to reach base, contribute to run production, and create scoring opportunities.
wOBA allows for more accurate player comparisons and can uncover hidden offensive gems that might be overlooked by traditional metrics.
Examples of Players With High and Low wOBA Values
Examining players with high and low wOBA values provides concrete examples of how this statistic can differentiate offensive performance:
High wOBA Values
Players with high wOBA values are generally considered to be exceptional offensive contributors. These players consistently demonstrate a strong ability to get on base and produce runs.
For example, Mike Trout, widely regarded as one of the best players in baseball, has consistently posted high wOBA values throughout his career, showcasing his offensive dominance.
Low wOBA Values
Players with low wOBA values may struggle to generate offense consistently. Their contributions at the plate may be limited, resulting in a lower impact on run production.
It is important to note that low wOBA values alone do not provide a comprehensive assessment of a player’s overall worth, as defensive or baserunning abilities may compensate for their offensive limitations.
wOBA has been widely embraced by teams, analysts, and scouts as a valuable tool for evaluating offensive performance in baseball. Its integration into the player evaluation and scouting processes allows for a more comprehensive understanding of a player’s offensive contributions, beyond traditional statistics.
By examining players with high and low wOBA values, teams can identify top offensive performers and make informed decisions to enhance their roster construction and overall team success.
Examples of Players With High and Low wOBA Values
| Player | wOBA | Team | League |
| Mike Trout | .430 | Los Angeles Angels | MLB |
| Mookie Betts | .391 | Los Angeles Dodgers | MLB |
| Freddie Freeman | .384 | Atlanta Braves | MLB |
| Juan Soto | .424 | Washington Nationals | MLB |
| José Ramírez | .390 | Cleveland Guardians | MLB |
| Billy Hamilton | .278 | Chicago White Sox | MLB |
| Dee Gordon | .288 | Cincinnati Reds | MLB |
| Maikel Franco | .286 | Baltimore Orioles | MLB |
| Albert Pujols | .290 | Los Angeles Dodgers | MLB |
| Miguel Rojas | .296 | Miami Marlins | MLB |
FAQs
How does wOBA compare to traditional statistics like batting average (BA) and on-base percentage (OBP)?
wOBA differs from traditional statistics like batting average and on-base percentage in that it assigns weights to different offensive events based on their run-scoring value.
Unlike BA, which only considers hits, and OBP, which treats all times on base equally, wOBA provides a more comprehensive assessment of a player’s offensive contributions by incorporating the specific value of each event.
Is wOBA suitable for comparing players across different eras or leagues?
wOBA is designed to be a context-neutral statistic, meaning it can be used to compare players across different eras or leagues.
However, it is important to consider contextual factors such as ballpark effects, changes in league-wide offensive environments, and other external factors that may influence wOBA values when making comparisons.
How frequently are the run values used in wOBA updated or adjusted?
The run values used in wOBA are typically based on extensive historical data analysis. While they are generally stable over time, adjustments may be made periodically as more data becomes available or as statistical methodologies evolve.
It is important to stay informed about any updates or adjustments to ensure accurate interpretation and comparisons.
Can wOBA be used to evaluate the offensive performance of pitchers?
wOBA is primarily designed to evaluate the offensive performance of hitters. It focuses on their ability to generate runs and contribute to the team’s offense.
For evaluating pitchers, there are other advanced metrics, such as Fielding Independent Pitching (FIP) or Expected Weighted On-Base Average (xwOBA), which provide insights into a pitcher’s effectiveness independent of their team’s defense.
Conclusion
wOBA (Weighted On-Base Average) has emerged as a valuable and widely adopted statistic in the realm of baseball analytics.
Through the assignment of observed run values and the inclusion of plate appearances, wOBA offers a more accurate measure of a player’s ability to generate runs and contribute to the team’s offense.
wOBA has significantly advanced our understanding of offensive performance in baseball. Its comprehensive nature, incorporation of run values, and integration into player evaluation processes have made it an indispensable tool for assessing a player’s offensive contributions. Have a nice day.