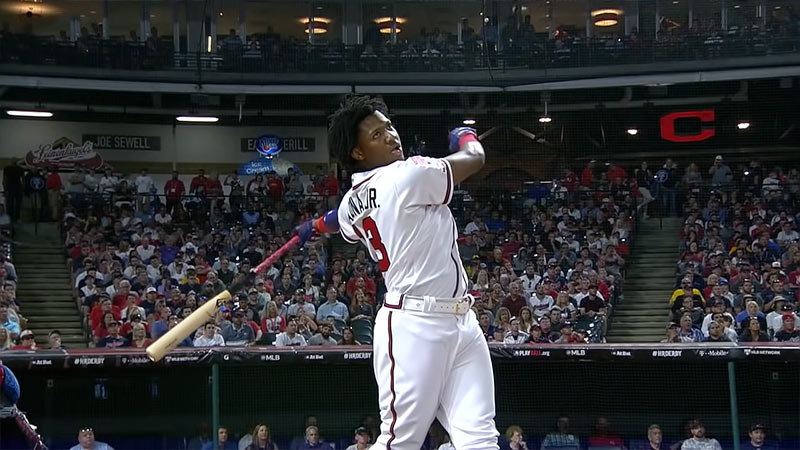
Baseball has always been a game deeply obsessed with numbers. For generations, traditional metrics like batting average, home runs, and runs batted in served as the ultimate measuring sticks for player performance. However, traditional box scores often leave out a critical piece of the puzzle: context.
When a player hits a screaming line drive straight into an outfielder’s glove, it goes down in the scorebook as an out.
Conversely, when a slow, spinning ground ball trickles just past a diving infielder, it goes down as a base hit. Both outcomes result from a ball put into play, but they tell wildly different stories about player capability, defensive positioning, and plain old fortune.
Enter BABIP—Batting Average on Balls in Play.
By stripping away outcomes that defense cannot influence, this modern analytical tool has transformed how front offices, analysts, and fans evaluate players.
Whether you are managing a fantasy baseball roster, tracking analytical trends, or trying to understand why a star hitter is suddenly slumping, understanding this metric is essential.
What Is BABIP and How Does It Work?
At its core, BABIP measures how frequently a ball in play goes for a base hit. It evaluates performance exclusively on events where the defensive alignment has an opportunity to make a play.
To understand why it matters, you have to look at what it intentionally leaves out. The formula completely removes:
- Strikeouts: The batter never touches the ball.
- Walks: The batter takes base passively via balls.
- Home Runs: The ball clears the fence entirely, rendering the defense helpless.
By removing these outcomes, the metric isolates the exact subset of plays where fielders, positioning, ballpark dimensions, and runner speed dictate the result.
The Mathematical Formula
The standard equation used by analysts to calculate the metric is:
Numerator: Total hits minus home runs (leaving only singles, doubles, and triples).
Denominator: All official at-bats, minus strikeouts, minus home runs, plus sacrifice flies.
The Baseline: Why the Magic Number Is .300
One of the most remarkable constants in baseball analytics is the league-wide baseline. Across decades of Major League Baseball history, the collective league average hovers consistently right around .300.
This universal constant acts as a gravitational pull for almost every player. While individual seasons will fluctuate, large sample sizes almost always regress toward that .300 baseline. Recognizing this trend allows analysts to spot anomalies instantly.
Case Study: Interpreting Outliers
The High Flier (.380+): If a hitter posts an abnormally high mark over a stretch of 150 plate appearances, they are frequently benefiting from fortunate placement, weak contact finding holes, or defensive miscues. Unless paired with elite underlying traits, regression is coming.
The Unlucky Sinker (.220-): If a hitter struggles with a depressed mark, they may simply be victims of terrible luck—hitting hard line drives directly at outfielders. Their underlying performance is likely better than their traditional batting average suggests.
Skill vs. Variance: What Drives BABIP?
While luck plays a massive role in small samples, certain players consistently defy the league-average baseline over long careers. This persistence proves that while variance exists, repeatable skills heavily influence outcomes.
1. Speed and Hustle
Players with elite running speed naturally pressure defenses. Fast runners turn routine ground balls into infield singles because they force fielders to rush throws.
Historical legends like Ty Cobb built their record-breaking profiles on this exact skill set. Cobb holds the highest career mark in MLB history at an astonishing .383, driven by his unmatched ability to pressure defenses and leg out hits.
2. Quality of Contact (Exit Velocity)
Hitters who consistently smash baseballs at high exit velocities alter the physics of the game. A soft ground ball can easily be fielded, but a line drive traveling at 105 miles per hour leaves fielders a fraction of a second to react.
Hard hitters naturally sustain higher metrics because their batted balls pierce through gaps more frequently.
Applying the Metric to Pitchers
While hitting analysis focuses on finding hidden growth or looming regression, pitching evaluation uses the metric from the opposite perspective.
When a pitcher allows a high mark over a few months, traditional scouts might panic and assume the pitcher is losing effectiveness.
Advanced analysts look deeper. If a pitcher’s strikeout and walk rates remain elite, but their allowed mark spikes to .340, it usually signals temporary bad luck or poor defensive play behind them.
Over time, that pitcher’s earned run average (ERA) will drop as their metrics normalize back toward league average.
Frequently Asked Questions
Is a high metric always a sign of luck?
Not always. While small-sample spikes are often driven by variance, players with exceptional raw speed or consistently high exit velocities can legitimately sustain metrics above the .300 baseline for extended periods.
Why are home runs excluded from the formula?
Home runs are excluded because they bypass the defense entirely. A home run is a purely binary outcome between the pitcher and hitter, whereas the metric’s purpose is to evaluate events where fielders have an active role.
How many plate appearances are needed for a reliable sample size?
Because balls in play accumulate slowly compared to total pitches or plate appearances, a full single season (roughly 400 to 500 plate appearances involving batted balls) is usually required to stabilize a player’s true talent baseline.
Conclusion
Understanding advanced concepts changes how you consume baseball. Looking past traditional batting averages allows you to see the underlying narrative of a game: separating the player who is genuinely thriving from the one who is simply catching a fortunate bounce.
By keeping an eye on these indicators, you can accurately predict future performance shifts long before they show up in standard box scores.