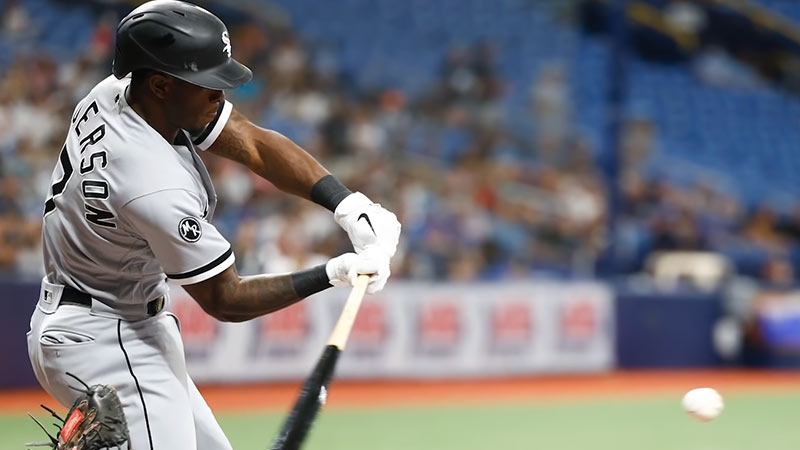
In the world of baseball, statistics reign supreme, offering an intricate tapestry that unravels a player’s prowess.
Among these metrics, the slash line, comprised of Batting Average (AVG), On-Base Percentage (OBP), and Slugging Percentage (SLG), serves as a barometer of offensive excellence.
But what truly constitutes a good slash line, and how has its definition evolved over time?
In this blog post, we embark on a journey through the hallowed statistics of baseball, deciphering what is a good slash line.
We’ll explore the history, significance, and context of each component, providing clarity on what benchmarks define offensive success.
Whether you’re a devoted baseball fan seeking to refine your understanding or a newcomer eager to unlock the game’s secrets, we’ll unveil the secrets behind this integral aspect of the sport. Stay focused.
What Is a Good Slash Line in Baseball?
A good slash line in baseball typically refers to a player’s batting statistics, and it consists of three key numbers: batting average (AVG), on-base percentage (OBP), and slugging percentage (SLG).
The ideal slash line may vary depending on the era and the player’s role, but as a general guideline, a solid slash line is often considered to be around .300 AVG / .400 OBP / .500 SLG.
A batting average of .300 means the player gets a hit roughly 30% of the time, a .400 OBP indicates a strong ability to reach base, and a .500 SLG signifies good power and extra-base hit potential.
Keep in mind that different positions and playing styles can influence what is considered a good slash line, but these benchmarks are a good starting point for assessing a player’s offensive performance.
Historical Context of MLB Slash Line
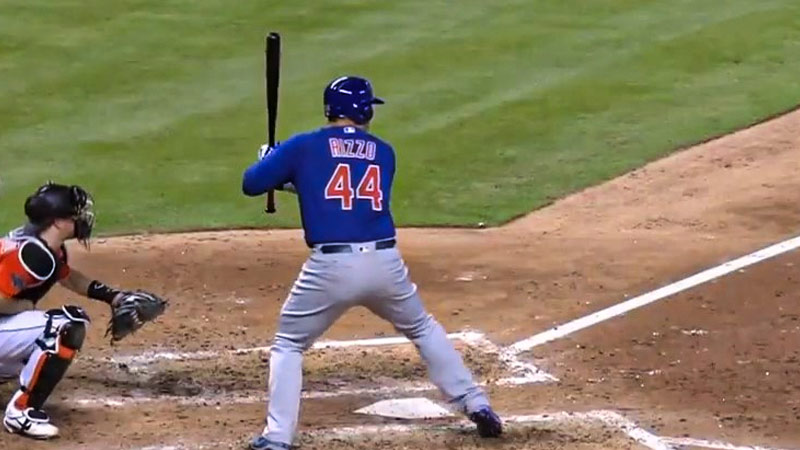
The historical context of the MLB slash line, which consists of batting average (AVG), on-base percentage (OBP), and slugging percentage (SLG), has evolved over time:
Early 20th Century
In the early days of baseball, batting average was often the primary measure of a player’s hitting prowess.
Players like Ty Cobb, who consistently hit over .400, were revered. OBP and SLG were less emphasized, as the focus was primarily on getting base hits.
“Moneyball” Era
In the early 2000s, with the popularity of Michael Lewis’s book “Moneyball,” OBP gained prominence.
Teams like the Oakland Athletics emphasized on-base skills, as it was seen as an efficient way to generate runs. Players like Jason Giambi and Scott Hatteberg were valued for their ability to draw walks and get on base.
Power Hitting Dominance
In the late 20th and early 21st centuries, the emphasis shifted to slugging percentage, particularly with the rise of power hitters like Barry Bonds and Mark McGwire, who were known for their ability to hit home runs and produce extra-base hits.
This period saw a rise in emphasis on SLG alongside AVG and OBP.
Modern Analytics
In recent years, advanced analytics have further reshaped the understanding of the slash line.
Metrics like weighted on-base average (wOBA) and weighted runs created plus (wRC+) provide a more comprehensive view of a player’s offensive contributions.
These stats consider the value of different types of hits and walks, giving a more nuanced view of a player’s performance.
The historical context of the MLB slash line reflects how the importance of each component (AVG, OBP, SLG) has evolved over time, influenced by changes in the game, player strategies, and advancements in statistical analysis.
Batting Average (AVG) in Baseball Slash Line
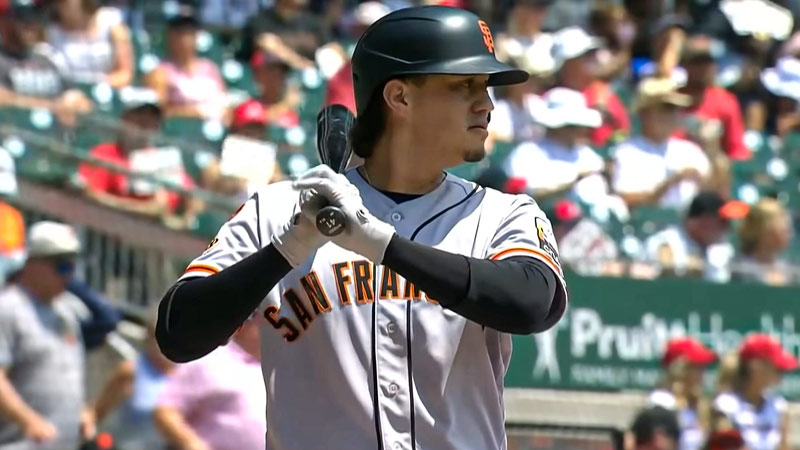
Batting Average (AVG) is one of the three components in a baseball slash line, along with On-Base Percentage (OBP) and Slugging Percentage (SLG).
It is a fundamental statistic used to measure a player’s ability to get base hits.
Here’s a more detailed explanation of Batting Average in the context of the slash line:
Calculation
Batting Average is calculated by dividing the number of hits a player gets by their total number of at-bats (AB).
The formula is AVG = Hits (H) / At-Bats (AB). For example, if a player has 150 hits in 500 at-bats, their batting average would be .300.
Importance
The Batting Average has historically been a prominent statistic in baseball. It provides a quick and simple way to assess a player’s ability to make contact and get base hits.
A high batting average, often around .300 or above, is generally considered a mark of a successful hitter.
Limitations
While AVG is easy to understand, it has limitations. It doesn’t take into account the quality of hits; a single and a home run both count the same.
Moreover, it doesn’t consider walks (a key component of OBP) or extra-base hits (considered in SLG), which are also important for assessing a player’s offensive value.
Evolution
In recent years, the significance of the Batting Average has been somewhat diminished as advanced statistics like OBP, and SLG, and more advanced metrics like weighted on-base average (wOBA) have gained prominence.
These metrics provide a more comprehensive view of a player’s offensive contributions, accounting for various aspects of hitting.
Batting Average, denoted by the AVG in the slash line, is a traditional and straightforward measure of a player’s ability to get base hits.
On-Base Percentage (OBP) in Slash Line Baseball
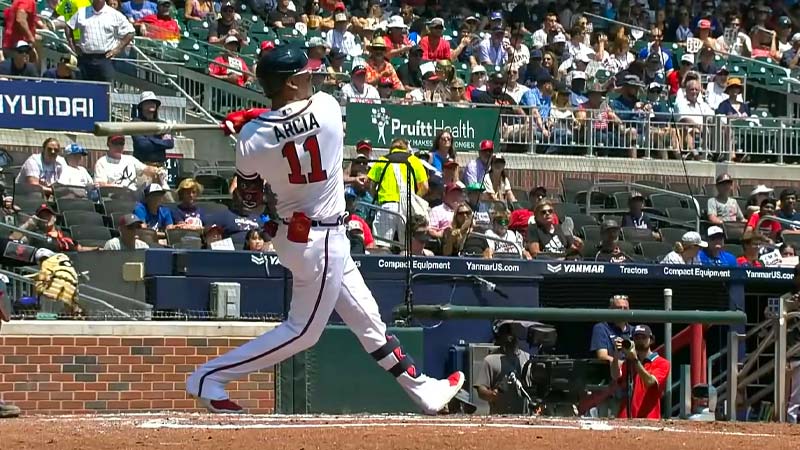
On-base percentage (OBP) is a critical component of a baseball slash line, which also includes Batting Average (AVG) and Slugging Percentage (SLG).
OBP measures a player’s ability to reach base safely, not only through base hits but also walks and hit-by-pitches.
Here’s a detailed explanation of OBP in the context of the slash line:
Calculation
OBP is calculated by adding the player’s hits (H), walks (BB), and hit-by-pitches (HBP), and then dividing this total by the sum of their at-bats (AB), walks, hit-by-pitches, and sacrifice flies (SF).
The formula is: OBP = (H + BB + HBP) / (AB + BB + HBP + SF).
Importance
OBP is highly regarded because it provides a comprehensive picture of a player’s ability to get on base, irrespective of whether it’s through hits or walks.
A high OBP indicates that a player is skilled at reaching base safely and extending innings, making them valuable to their team’s offense.
Advantages
OBP is often preferred over Batting Average (AVG) alone because it accounts for walks and hit-by-pitches, recognizing that a walk can be as valuable as a base hit in terms of generating runs.
This statistic rewards players who work the count, see a lot of pitches, and get on base consistently.
Team Contributions
OBP is particularly important in assessing a player’s contribution to team success.
Players with high OBP can create more opportunities for their teammates to drive in runs, and it aligns with the philosophy of “small ball” where getting runners on base is a primary strategy.
Comparison
A solid OBP often hovers around .350 or higher. However, elite players may have OBPs well above .400, indicating exceptional plate discipline and on-base skills.
On-base percentage (OBP) is a vital component of the baseball slash line, representing a player’s ability to reach base safely through hits, walks, and hit-by-pitches.
What Is Slugging Percentage (SLG)?
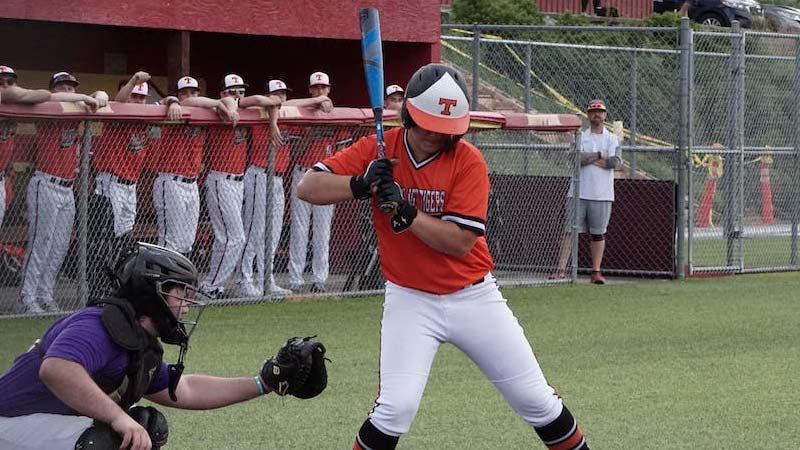
Slugging Percentage (SLG) is a crucial statistic in baseball that measures a player’s power-hitting ability and extra-base hit production.
It’s one of the three components in a baseball slash line, along with Batting Average (AVG) and On-Base Percentage (OBP). Here are some key points about Slugging Percentage:
Calculation
SLG is calculated by adding the total bases (TB) a player accumulates through their hits (singles, doubles, triples, and home runs) and then dividing this sum by the player’s total at-bats (AB).
The formula is SLG = Total Bases (TB) / At-Bats (AB). For instance, if a player has 200 total bases in 500 at-bats, their slugging percentage would be .400.
Importance
SLG emphasizes a player’s ability to produce extra-base hits and contribute power to their team’s offense.
It distinguishes between players who can hit for power, such as home runs and doubles, from those who primarily collect singles.
It’s especially relevant when assessing the run-producing capabilities of a player.
Differentiating Hitters
SLG helps differentiate between two players with the same batting average. For example, two players with a .300 batting average may have vastly different slugging percentages.
The one with more extra-base hits and power will have a higher SLG, indicating a greater offensive impact.
Context and Considerations
A .500 SLG is generally considered an excellent mark, indicating that a player can consistently produce extra-base hits.
However, the importance of SLG may vary depending on a player’s role and the era they play in.
For example, power-hitting outfielders are expected to have higher SLGs than contact-oriented infielders.
Slugging Percentage (SLG) is a key statistic in baseball that measures a player’s power-hitting ability and extra-base hit production.
FAQs
What is a good slash line in baseball?
A good slash line in baseball typically consists of Batting Average (AVG) / On-Base Percentage (OBP) / Slugging Percentage (SLG) around .300 AVG / .400 OBP / .500 SLG.
These numbers indicate a player’s ability to hit for average, get on base, and provide power in their offensive performance.
Can a player with a below-average batting average still have a good slash line?
Yes, a player can have a good slash line with a below-average batting average if their OBP and SLG compensate.
For example, a player with .250 AVG, .400 OBP, and .550 SLG showcases strong plate discipline and power.
Is a good slash line the same for all positions in baseball?
No, a good slash line can vary by position. Power hitters, like first basemen and outfielders, might have higher SLG expectations, while contact-oriented players, such as middle infielders, may focus more on AVG and OBP.
Are there variations in what’s considered a good slash line over different eras of baseball?
Yes, what’s considered a good slash line can change over time due to shifts in the game’s dynamics.
Historical and contextual factors, such as changes in equipment, pitching, and playing conditions, can influence the benchmarks for a good slash line.
Are there any advanced statistics that provide a more comprehensive view of a player’s offensive performance than the traditional slash line?
Yes, advanced metrics like weighted on-base average (wOBA) and weighted runs created plus (wRC+) offer a more nuanced assessment of a player’s offensive contribution.
They consider the value of hits, walks, and power in generating runs and provide a more comprehensive picture of a player’s performance.
Wrapping Up
In the ever-evolving world of baseball, understanding what constitutes a good slash line is crucial for players, coaches, and fans alike.
We’ve journeyed through the history, significance, and context of Batting Average (AVG), On-Base Percentage (OBP), and Slugging Percentage (SLG).
These metrics offer a snapshot of a player’s offensive capabilities, reflecting changes in the game’s strategy and dynamics.
A good slash line has morphed over the years, adapting to various eras and player roles. Today, it’s more comprehensive than ever, considering power, discipline, and run-producing abilities.
As baseball statistics continue to evolve, so too does our appreciation for the multifaceted nature of offensive performance.
Whether you’re a sabermetrics enthusiast or simply a passionate baseball lover, recognizing the value of a good slash line enhances your appreciation of the game and the players who excel within it.
So, as you watch the next pitch or step up to the plate, remember, that the slash line tells a story, and that story is as dynamic as the game itself. Best of luck.

