Baseball is a sport built on numbers. From batting averages to earned run averages, statistics have always played a crucial role in evaluating players’ performance and determining team strategies. These numbers help fans, coaches, and analysts gain a deeper understanding of the game.
In this article, we’ll explore a comprehensive list of baseball statistics, shedding light on the significance of each one.
List of Baseball Statistics
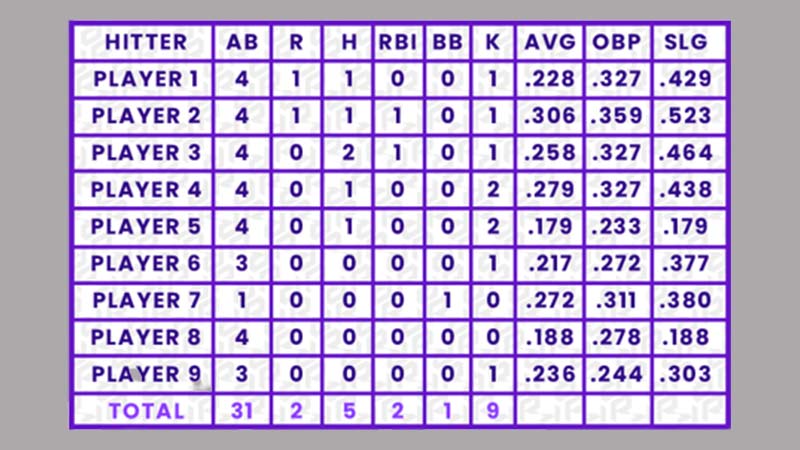
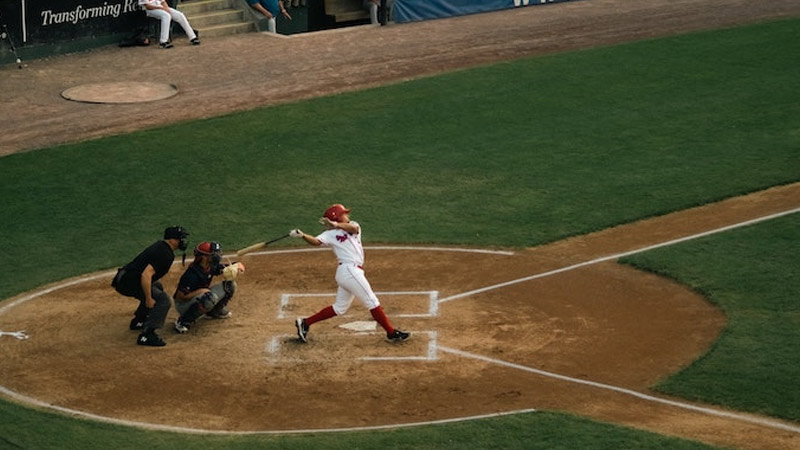
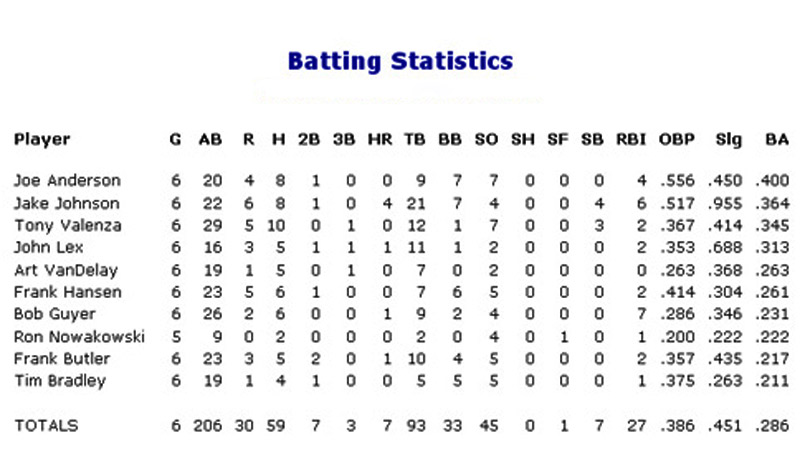
Baseball Batting Stats

Source: allprosoftware.com
When it comes to baseball batting stats, there are several key statistics that are commonly used to evaluate a batter’s performance. Let’s take a look at some of the important batting statistics in baseball:
Batting Average (AVG)

Batting average is perhaps the most well-known and traditional statistic in baseball. It is calculated by dividing the total number of base hits by the total number of at-bats. Batting average measures a batter’s ability to make contact with the ball and get a hit. A high batting average indicates consistent hitting.
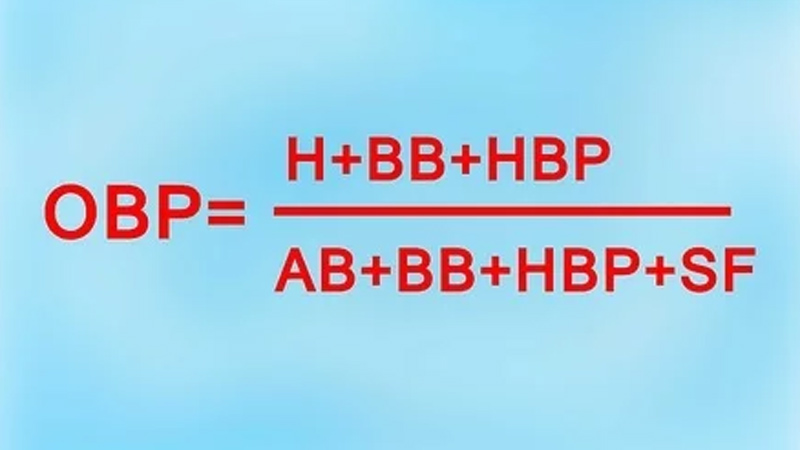
On-Base Percentage (OBP)
Source: wikihow.com
On-base percentage measures a batter’s ability to reach base safely, including hits, walks, and hit-by-pitches. It is calculated by dividing the sum of hits, walks, and hit-by-pitches by the sum of at-bats, walks, hit-by-pitches, and sacrifice flies. OBP provides a broader picture of a batter’s ability to contribute to the offense by getting on base.
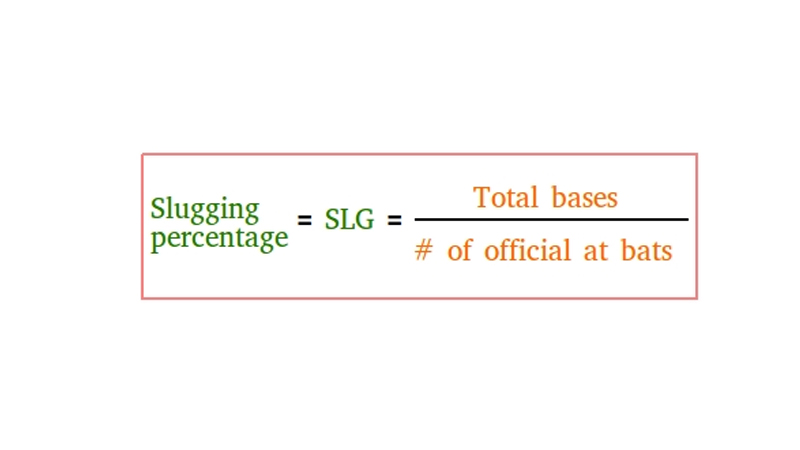
Slugging Percentage (SLG)
Source: basic-mathematics.com
Slugging percentage quantifies a batter’s power and ability to hit for extra bases. It is calculated by dividing the total number of bases (1 for a single, 2 for a double, 3 for a triple, and 4 for a home run) by the total number of at-bats. SLG gives more weight to extra-base hits and provides insight into a batter’s ability to drive the ball.
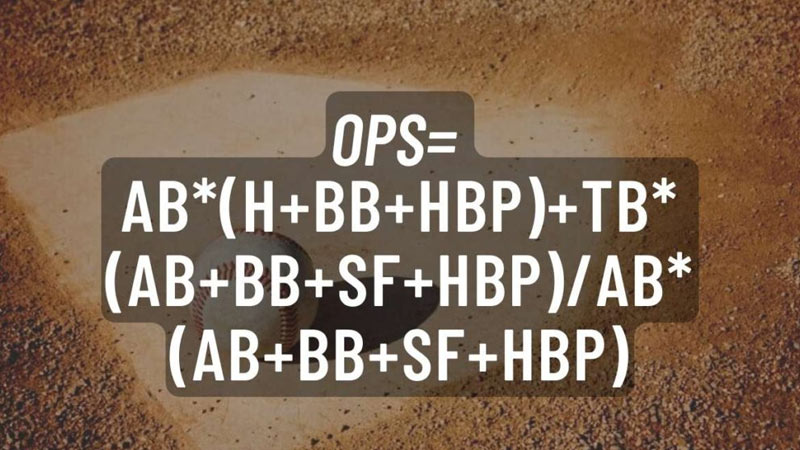
On-Base Plus Slugging (OPS)
Source: honestbaseball.com
OPS combines a batter’s on-base percentage and slugging percentage to provide an overall measure of offensive performance. It is calculated by summing OBP and SLG. OPS is a popular statistic for evaluating a batter’s overall offensive contribution, as it combines both their ability to get on base and hit for power.
Runs Batted In (RBI)
Runs batted in represents the number of runs a batter drives in with their hits or productive outs. It counts each time a runner scores due to the batter’s plate appearance. RBI reflects a batter’s ability to contribute to their team’s scoring.
Home Runs (HR)
Source: baseballscouter.com
Home runs are a measure of a batter’s power. It represents the number of times a batter hits the ball over the outfield fence, resulting in a run scored. Home runs showcase a batter’s ability to hit for distance and drive in runs.
Walks (BB)

Source: baseballbible.net
Walks indicate the number of times a batter receives four balls from the pitcher, resulting in a free pass to first base. Walks demonstrate a batter’s ability to show plate discipline, patience, and the capacity to work the count in their favor.
Strikeouts (K)

Source: totalsportswire.com
Strikeouts represent the number of times a batter is unable to make contact with the ball and is called out after receiving three strikes. Strikeouts can reflect a batter’s difficulty in making consistent contact with pitches.
Hits (H)

Source: stcatharinesstandard.ca
Hits refer to the number of times a batter successfully reaches base with a fair hit that is not an error or fielder’s choice. Hits include singles, doubles, triples, and home runs.
Doubles (2B), Triples (3B), and Extra-Base Hits (XBH)
Source: baseballscouter.com
Doubles and triples represent the number of times a batter hits the ball and safely reaches second and third base, respectively. Extra-base hits count all hits that result in more than a single, including doubles, triples, and home runs. XBH showcases a batter’s power and ability to hit for extra bases.
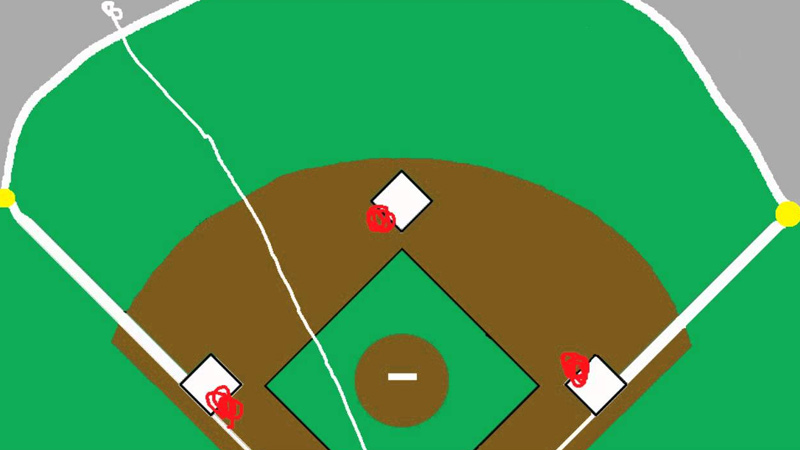
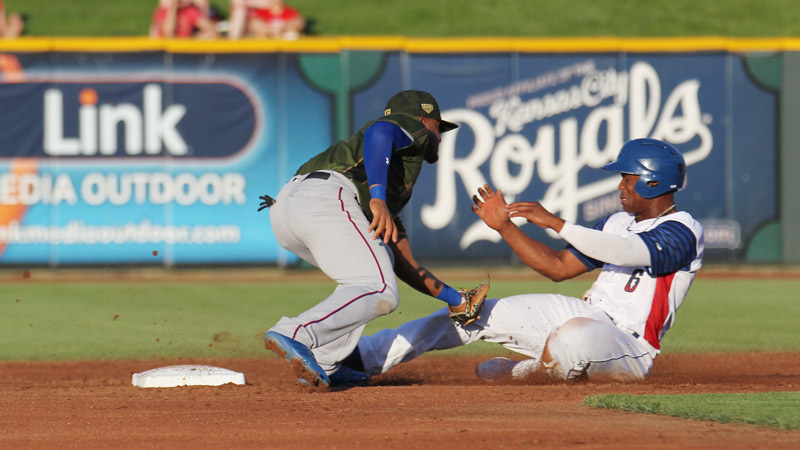
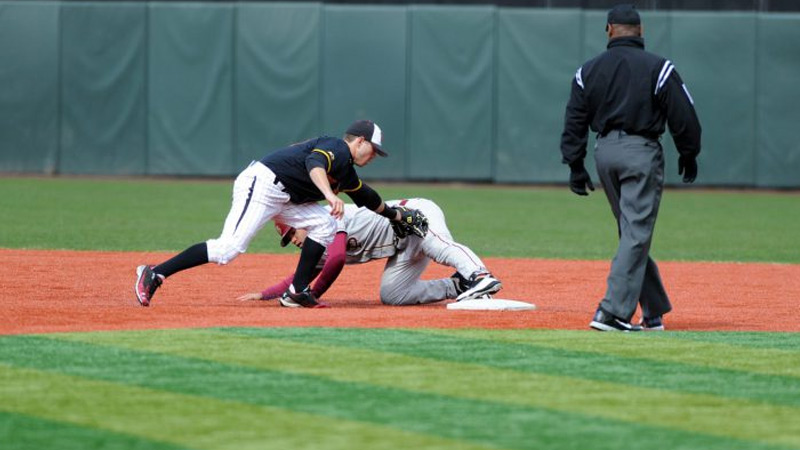
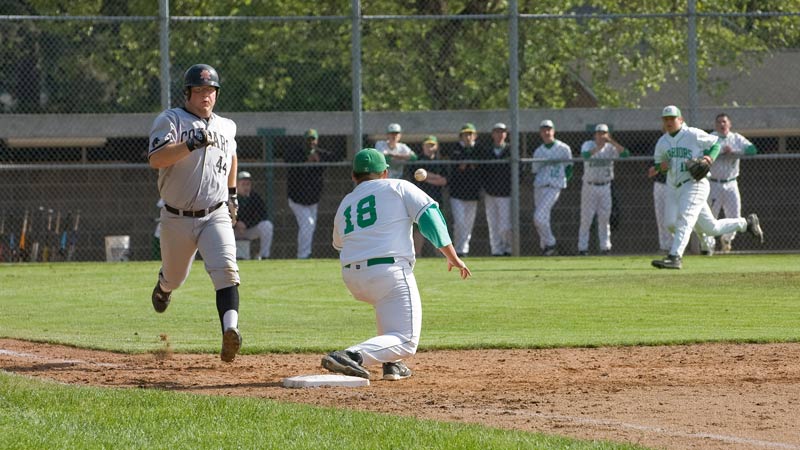
Baseball Baserunning Stats

Source: ocregister.com
Baserunning is a critical aspect of baseball, and several statistics help evaluate a player’s skills and effectiveness on the basepaths. Let’s explore some important baserunning statistics used in baseball:
Stolen Bases (SB)
Source: wikipedia.org
Stolen bases measure the number of successful base thefts by a runner. It reflects a player’s speed, agility, and ability to read the pitcher’s delivery and the catcher’s arm. Stolen bases can put pressure on the opposing team’s defense and create scoring opportunities.
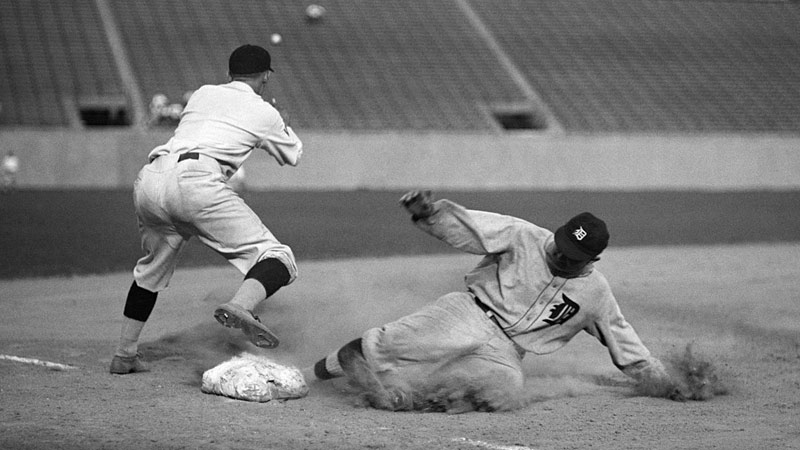
Caught Stealing (CS)
Source: wikipedia.org
Caught stealing is the number of unsuccessful stolen base attempts resulting in the runner being thrown out. It represents a player’s aggressiveness and success rate when attempting to steal a base. A low caught stealing percentage indicates a runner’s proficiency in judging opportunities to steal.
Stolen Base Percentage (SB%)
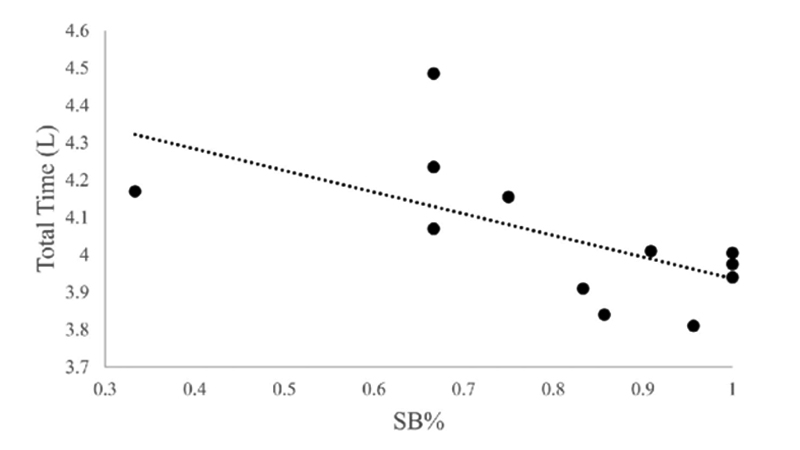
Source: researchgate.net
Stolen base percentage is calculated by dividing the number of successful stolen bases (SB) by the sum of successful stolen bases and caught stealing (CS). It provides a measure of a player’s efficiency and success rate in stealing bases. A high stolen base percentage suggests a player has good timing and decision-making on the basepaths.
Runs Scored (R)
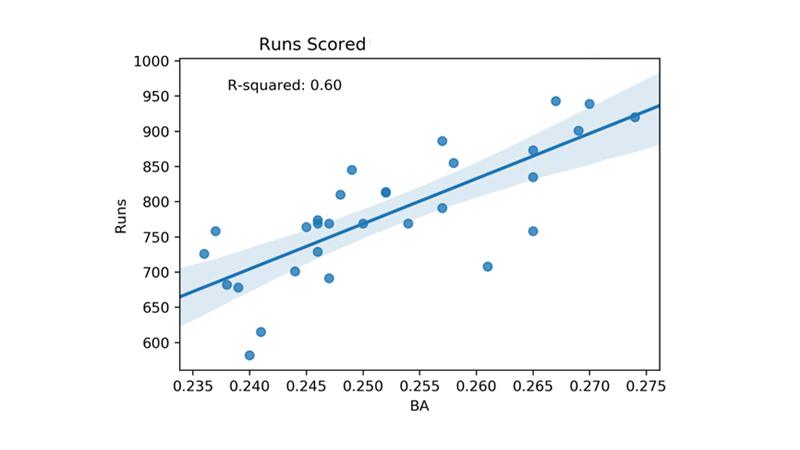
Source: advancedsqlpuzzles.com
Runs scored indicate the number of times a baserunner crosses home plate and scores a run. It measures a player’s ability to take advantage of scoring opportunities created by teammates’ hits, walks, or other means. A high number of runs scored reflects a player’s baserunning skills and ability to read the game.
Triples (3B)
Source: wikipedia.org
Triples represent the number of times a batter hits the ball and reaches third base safely without the ball being misplayed or an error occurring. Triples require speed, aggressive baserunning, and the ability to take extra bases on hits.
Extra Bases Taken (XBT)

Source: grbacademy.com
Extra bases taken track the number of times a baserunner advances more than one base on a single or more than two bases on a double. It reflects a player’s ability to maximize their baserunning opportunities and take advantage of defensive miscues or lack of arm strength from outfielders.
Times Caught on the Bases (TOB)
Source: keepplayingbaseball.org
Times caught on the bases count the number of times a baserunner is picked off, caught in a rundown, or otherwise tagged out while attempting to advance. It represents a player’s baserunning mistakes or aggressiveness that did not pay off.
Baserunning Wins Above Average (BsR)

Source: thedrummeyangle.com
Baserunning wins above average is an advanced metric that quantifies a player’s overall baserunning value. It takes into account stolen bases, taking extra bases, avoiding double plays, and other baserunning aspects to evaluate a player’s overall impact on the bases.
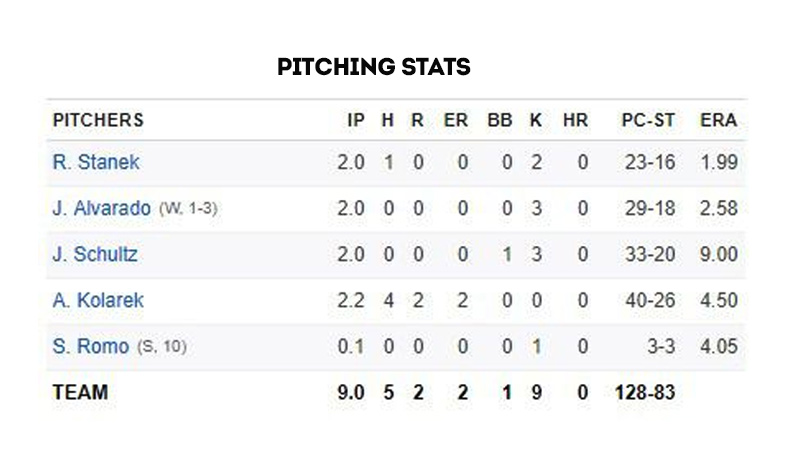
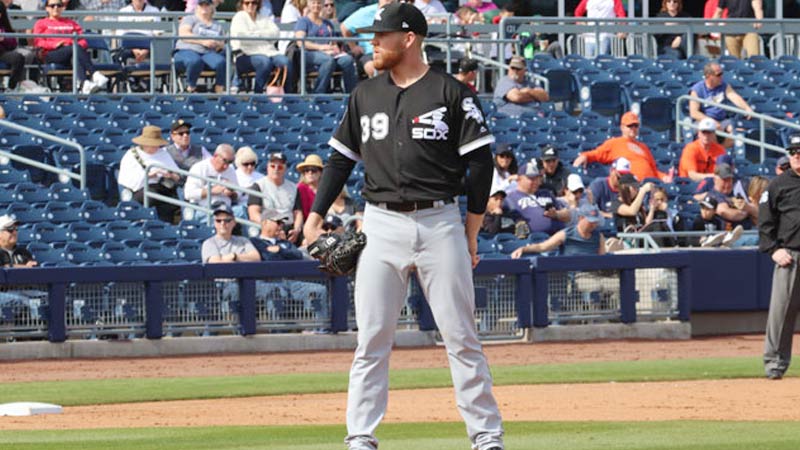
Baseball Pitching Stats
Source: blessyouboys.com
Pitching statistics in baseball are crucial in evaluating a pitcher’s performance and effectiveness on the mound. Here are some key pitching stats commonly used:
Earned Run Average (ERA)
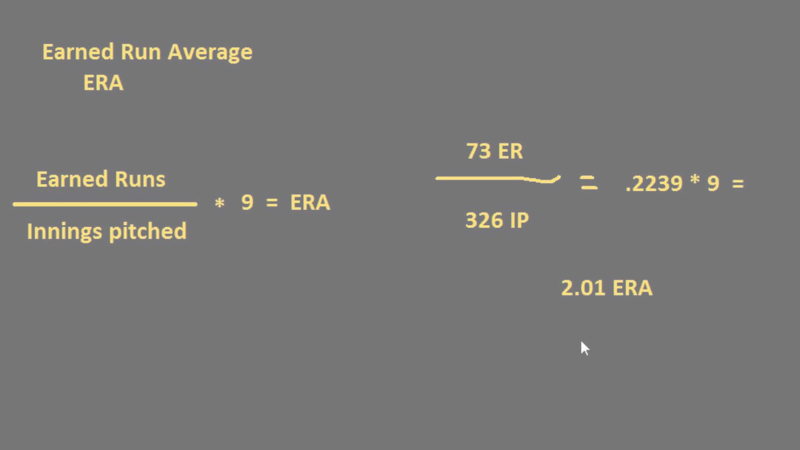
Earned Run Average is one of the fundamental pitching statistics. It measures the average number of earned runs a pitcher allows per nine innings pitched. It is calculated by multiplying the total earned runs by nine and dividing it by the total innings pitched. A lower ERA indicates more effective pitching.
WHIP (Walks plus Hits per Innings Pitched)
Source: baconsportsbeer.com
WHIP is a statistic that measures a pitcher’s ability to limit baserunners. It is calculated by adding the total number of walks and hits allowed and dividing it by the total number of innings pitched. WHIP gives insight into a pitcher’s control and ability to prevent opponents from reaching base.
Strikeouts per Nine Innings (K/9)
This statistic measures a pitcher’s ability to record strikeouts. It calculates the average number of strikeouts a pitcher records per nine innings pitched. It reflects a pitcher’s ability to overpower batters and is often used to evaluate their dominance on the mound.
Walks per Nine Innings (BB/9)

Source: kingsofkauffman.com
Walks per nine innings are a statistic that quantifies a pitcher’s control. It calculates the average number of walks a pitcher issues per nine innings pitched. A lower BB/9 indicates better control and command of pitches.
Home Runs per Nine Innings (HR/9)

Source: espn.in
Home runs per nine innings are a measure of a pitcher’s susceptibility to giving up home runs. It calculates the average number of home runs a pitcher allows per nine innings pitched. A lower HR/9 suggests a pitcher’s ability to keep the ball in the ballpark and limit extra-base hits.
Strikeout-to-Walk Ratio (K/BB)

Source: rotoballer.com
The strikeout-to-walk ratio compares the number of strikeouts to the number of walks issued by a pitcher. It provides an indication of a pitcher’s control, ability to generate strikeouts, and overall effectiveness on the mound. A higher K/BB ratio is generally considered favorable.
Wins (W) and Losses (L)
Source: sportingnews.com
Wins and losses are traditional pitching statistics that reflect the outcomes of games in which a pitcher was the starting pitcher or the pitcher of record when the team took the lead. While wins and losses are influenced by team performance, they can still provide some insight into a pitcher’s effectiveness.
Save (SV)

Source: wikipedia.org
Save is a statistic that credits a relief pitcher who successfully preserves a lead for their team. A save is awarded when a relief pitcher finishes a game, meets certain criteria, and maintains a lead until the end. Saves indicate a reliever’s ability to close out games and protect leads.
Games Started (GS)

Source: savannahnow.com
Games started to track the number of games in which a pitcher was the starting pitcher. It provides an understanding of a pitcher’s role in the rotation and their durability as a starter.
Innings Pitched (IP)

Innings pitched represent the total number of innings a pitcher has thrown. It reflects a pitcher’s endurance and workload.
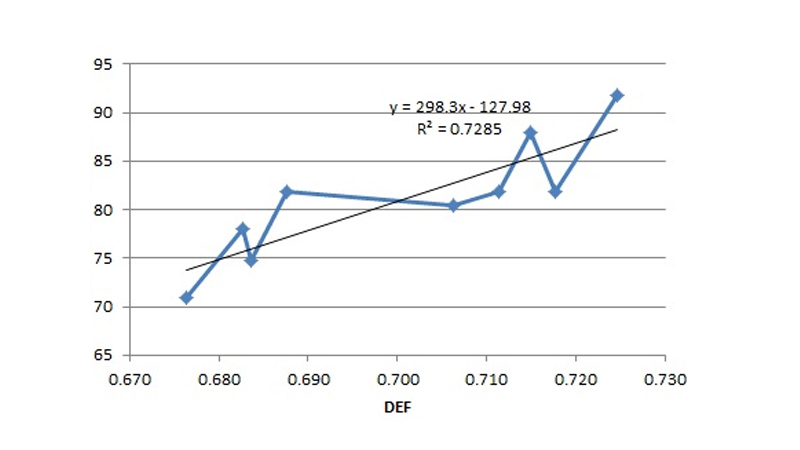
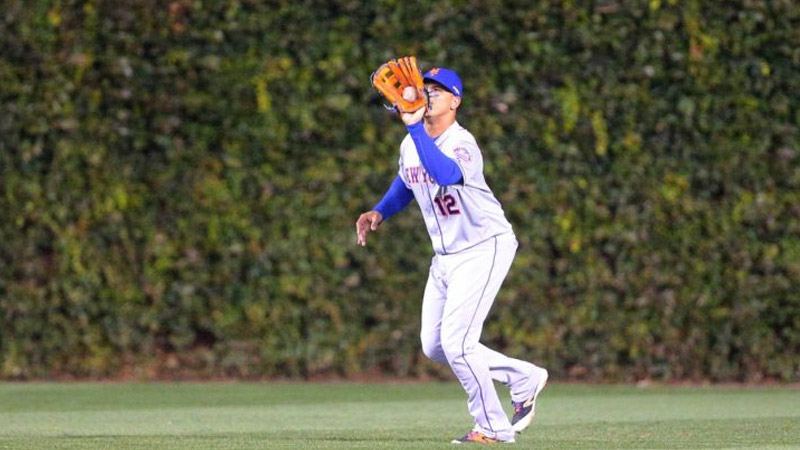
Baseball Fielding Stats
Source: allprosoftware.com
Fielding stats in baseball provide valuable insights into a player’s defensive abilities and performance. Here are some key fielding statistics commonly used:
Fielding Percentage (FPCT)
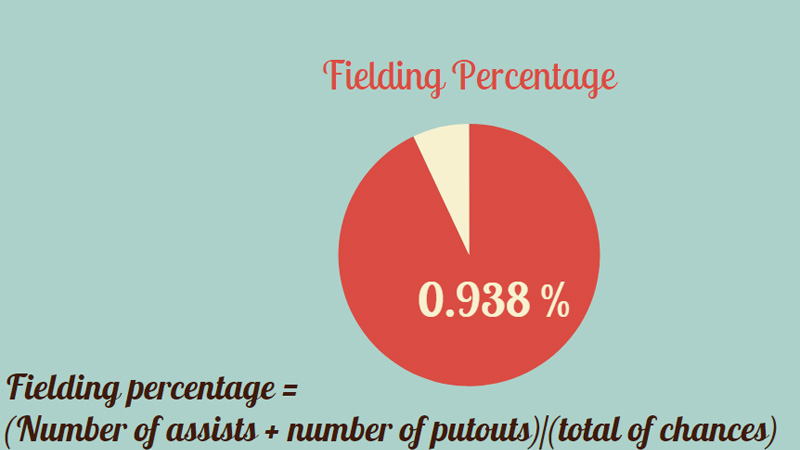
Source: firstbase-baseball.ru
Fielding percentage is one of the traditional and simplest fielding stats. It calculates the ratio of successful fielding attempts (putouts and assists) to the total number of chances (successful attempts, errors, and passed balls). Fielding percentage measures a player’s reliability in making routine plays. However, it doesn’t account for a player’s range or ability to make difficult plays.
Range Factor (RF)
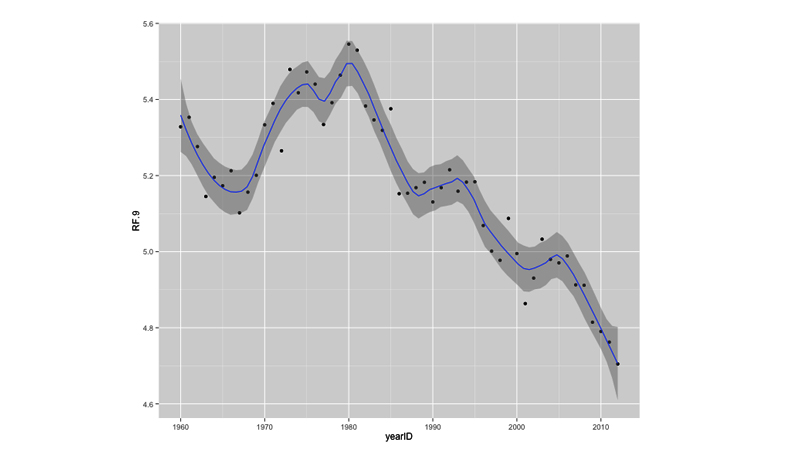
Source: baseballwithr.wordpress.com
Range factor measures a player’s range and involvement in defensive plays. It is calculated by dividing putouts and assists by the number of innings played in the field. RF provides an estimate of how many plays a player makes per game or per nine innings. A higher range factor indicates a player’s ability to cover ground and make plays.
Ultimate Zone Rating (UZR)
Source: bullpenbycommittee.com
Ultimate Zone Rating is an advanced fielding metric that evaluates a player’s overall defensive contribution. It takes into account factors such as range, arm strength, and double-play ability. UZR compares a player’s defensive performance to the average for their position, providing a comprehensive assessment of their defensive value.
Defensive Runs Saved (DRS)
Source: metsmerizedonline.com
Defensive Runs Saved is another advanced metric that quantifies the number of runs a player saves or costs their team through their defensive performance. It evaluates a player’s ability to prevent hits, makes outstanding plays, and turn potential hits into outs. A positive DRS indicates above-average defensive performance, while a negative DRS suggests below-average performance.
Errors (E)

Source: wikipedia.org
Errors track the number of mistakes made by a fielder that result in allowing a batter or baserunner to reach base or advance extra bases. Errors are a simple count of fielding miscues and do not account for the difficulty of the play or a player’s overall defensive ability.
Assists (A)

Source: wikipedia.org
Assists measure the number of times a fielder throws to a teammate to record an out. It reflects a player’s involvement in defensive plays and their ability to make accurate throws to complete outs.
Putouts (PO)
Source: wikipedia.org
Putouts track the number of times a fielder records an out by catching a batted ball or receiving a thrown ball. Putouts indicate a fielder’s ability to make routine plays and contribute to defensive success.
Double Plays Turned (DP)

Source: wikipedia.org
Double plays are turned to represent the number of times a fielder, often a middle infielder participates in turning a double play. It demonstrates a fielder’s ability to quickly transition from receiving a throw to making an accurate relay, resulting in two outs on a single play.
FAQs
How is batting average calculated, and what does it indicate?
Batting average is calculated by dividing the total number of base hits by the total number of at-bats and is expressed as a three-digit decimal. For example, if a player has 150 hits in 500 at-bats, their batting average would be .300. It indicates a player’s success in making contact with the ball and getting a hit during their plate appearances.
How is OPS useful in evaluating a player’s offensive performance?
OPS (On-Base Plus Slugging) combines a player’s on-base percentage (OBP) and slugging percentage (SLG) into a single statistic. It provides a comprehensive measure of a player’s offensive contribution by taking into account both their ability to reach base safely and their power hitting. A higher OPS indicates a more productive offensive player.
What is the significance of ERA in evaluating a pitcher’s performance?
ERA (Earned Run Average) is a key statistic for pitchers, measuring the average number of earned runs they allow per nine innings pitched. It provides an indication of a pitcher’s effectiveness in preventing opposing teams from scoring. A lower ERA is generally considered better, as it reflects a pitcher’s ability to limit runs and control the game from the mound.
How are stolen bases (SB) beneficial in baseball?
Stolen bases are a measure of a player’s speed and ability to successfully steal a base while the opposing team attempts to throw them out. Stolen bases can create scoring opportunities and put pressure on the opposing team’s defense. Players who excel at stealing bases can disrupt the pitcher’s rhythm and contribute to their team’s offensive strategy.
What does fielding percentage (FPCT) tell us about a player’s defensive ability?
Fielding percentage is a statistic used to evaluate a player’s defensive skills. It measures the ratio of successful fielding attempts (putouts and assists) to total fielding attempts (successful attempts, errors, and sometimes passed balls). A higher fielding percentage indicates a more reliable fielder who makes fewer errors and completes defensive plays successfully.
Final Words
There you have a list of baseball statistics. Each statistic provides valuable insights into different aspects of the game, helping fans and analysts better understand and appreciate the performances of players and teams.
Whether it’s a batter’s ability to hit for average, a pitcher’s effectiveness on the mound, or a fielder’s defensive prowess, these numbers offer a deeper understanding of America’s beloved pastime.