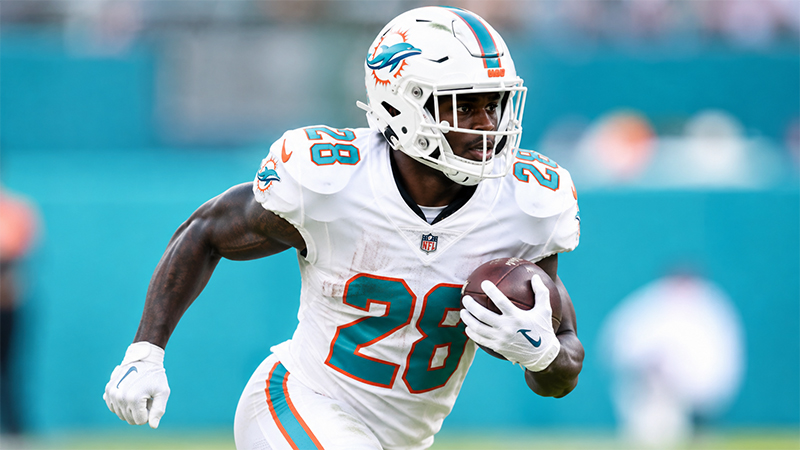
In May 2026, the Miami Dolphins finalized a four-year, $64 million contract extension with running back De’Von Achane, keeping him anchored in Miami through the 2030 NFL season.
Drafted 84th overall in the third round of the 2023 NFL Draft out of Texas A&M, Achane has transitioned from a high-efficiency rotational playmaker into the centerpiece of Miami’s high-speed offense.
The contract carries an Average Annual Value (AAV) of $16 million. This places Achane among the highest-paid running backs in the NFL, ranking third overall in compensation behind Saquon Barkley and Christian McCaffrey. The structure features $32 million in total guarantees, with $17,378,000 fully guaranteed upon signing.
Primary Extension Terms
| Contract Component | Financial Value | Operational Details |
|---|---|---|
| Contract Length | 4 Years | Extension active from 2027 through 2030 (overriding remaining rookie deal structure). |
| Base Contract Value | $64,000,000 | Baseline value paid across four extension seasons ($16.0M APY). |
| Incentive Ceiling | $68,000,000 | Up to $4.0M in total performance incentives available across the duration. |
| Total Guarantees | $32,000,000 | Total structural guarantees earned across contract life. |
| Full Guarantees at Signing | $17,378,000 | Fully secured capital including signing bonus and early base salaries. |
| Signing Bonus | $4,233,000 | Paid upfront upon execution in May 2026. |
| Per-Game Roster Bonuses | $4,000,000 Total | Up to $1,000,000 available per year ($62,500 per active game) from 2027 to 2030. |
| Workout Bonuses | $1,100,000 Total | $500,000 in 2027, followed by $200,000 annually from 2028 through 2030. |
Position Allocation & Market Valuation Matrix
| Player | Team | Contract Value | Average Annual Value (AAV) | Total Guarantees | Market Rank (APY) |
|---|---|---|---|---|---|
| Christian McCaffrey | San Francisco 49ers | Elite Tier | Top Market Leader | High Multi-Year | #1 |
| Saquon Barkley | Philadelphia Eagles | Premium Tier | Upper Market Leader | High Multi-Year | #2 |
| De’Von Achane | Miami Dolphins | $64,000,000 | $16,000,000 | $32,000,000 | #3 |
| Top Tier Average | NFL League Average | Industry Standard | Positional Benchmark | Adjusted Baseline | Top 5 Baseline |
Year-by-Year Financial Architecture (2026–2030)
The Dolphins structured Achane’s extension to optimize their salary cap management.
By keeping his initial salary cap hit low, Miami preserves flexibility during the early years while pushing larger cap hits into future seasons.
In 2026, Achane carries a base salary of $1,145,000 alongside a prorated signing bonus charge of $2,009,627, resulting in a total cap charge of just $3,154,627 (accounting for 1.0% of the team’s salary cap).
However, his actual cash payout in 2026 reaches $10,000,000 due to his upfront signing bonus and base structure.
Year-by-Year Financial Breakdown Matrix
| Year | Age | Base Salary | Prorated Bonus | Per Game Roster Bonus | Workout Bonus | Total Cap Charge | Cap % | Cash Payout | Dead Money |
|---|---|---|---|---|---|---|---|---|---|
| 2026 | 25 | $1,145,000 | $2,009,627 | $0 | $0 | $3,154,627 | 1.0% | $10,000,000 | $22,238,627 |
| 2027 | 26 | $10,500,000 | $1,771,000 | $1,000,000 | $500,000 | $13,771,000 | 4.2% | $12,000,000 | $19,084,000 |
| 2028 | 27 | $14,225,000 | $1,771,000 | $1,000,000 | $200,000 | $17,196,000 | 4.9% | $15,425,000 | $5,313,000 |
| 2029 | 28 | $14,225,000 | $1,771,000 | $1,000,000 | $200,000 | $17,196,000 | TBD | $15,425,000 | $3,542,000 |
| 2030 | 29 | $15,717,000 | $1,771,000 | $1,000,000 | $200,000 | $18,688,000 | TBD | $16,917,000 | $1,771,000 |
| Total | — | $55,812,000 | $9,093,627 | $4,000,000 | $1,100,000 | $70,005,627 | — | $73,629,645 | — |
Cash Flow vs. Cap Charge Trajectory
| Season | Running Cash Paid | Cumulative Cap Hit | Cash-to-Cap Ratio | Structural Alignment Focus |
|---|---|---|---|---|
| 2026 | $4,233,000 (Bonus focus) / $10.0M total | $3,154,627 | 3.17 | Maximize upfront player cash while keeping cap impact low. |
| 2027 | $16,233,000 | $16,925,627 | Moderate | Balanced cash distribution as base salary rises to $10.5M. |
| 2028 | $31,658,000 | $34,121,627 | Balanced | Full integration into elite cap allocation tier. |
| 2029 | $47,083,000 | $51,317,627 | Balanced | Peak career earnings period. |
| 2030 | $64,000,000 | $70,005,627 | 0.91 | Final year of contract extension. |
Statistical Evolution & Workload Transformation (2023–2025)
This extension is backed by Achane’s strong statistical growth over his first three NFL seasons. Across his entry contract, Achane transformed from an efficient, low-volume rookie into a high-volume workhorse and dual-threat weapon.
During his rookie campaign in 2023, Achane played in 11 games with a 27.3% offensive snap share. Despite limited touches, he posted an impressive 7.8 yards per carry, rushing for 800 yards and 8 touchdowns on 103 carries.
By 2025, his role expanded significantly: he played in 16 games, handled a 70.9% snap share, and recorded a career-high 1,350 rushing yards along with 67 receptions.
Yearly On-Field Performance Progression
| Metric | 2023 Season | 2024 Season | 2025 Season | 3-Year Career Totals |
|---|---|---|---|---|
| Games Played (Active) | 11 Games | 17 Games | 16 Games | 44 Games |
| Offensive Snap Share % | 27.3% | 61.9% | 70.9% | 53.3% Avg |
| Rushing Attempts | 103 Carries | 203 Carries | 238 Carries | 544 Carries |
| Rushing Yards | 800 Yards | 907 Yards | 1,350 Yards | 3,057 Rushing Yards |
| Yards Per Carry (YPC) | 7.8 YPC | 4.5 YPC | 5.7 YPC | 5.6 YPC Career Avg |
| Rushing Touchdowns | 8 TDs | 6 TDs | 8 TDs | 22 Rushing TDs |
| Receptions | 27 Rec | 78 Rec | 67 Rec | 172 Receptions |
| Receiving Yards | 197 Yards | 592 Yards | 488 Yards | 1,277 Receiving Yards |
| Yards Per Reception | 7.3 YPR | 7.6 YPR | 7.3 YPR | 7.4 YPR Career Avg |
| Receiving Touchdowns | 3 TDs | 6 TDs | 4 TDs | 13 Receiving TDs |
| Total Touchdowns | 11 TDs | 12 TDs | 12 TDs | 35 Total TDs |
| Fumbles Lost | 0 Lost | 0 Lost | 0 Lost | 0 Fumbles Lost |
Workload Efficiency & Production Comparison
| Performance Metric | Rookie Baseline (2023) | Prime Production (2025) | Net Growth / Change |
|---|---|---|---|
| Weekly Snap Volume | Rotational (27.3% Share) | Featured Workhorse (70.9% Share) | +43.6% Increase in Snap Share |
| Scrimmage Yards Total | 997 Total Yards | 1,838 Total Yards | +84.4% Total Yardage Expansion |
| Receiving Target Volume | 27 Receptions | 67 Receptions | +148.1% Dual-Threat Utilization |
| Ball Security Rate | 0 Fumbles Lost | 0 Fumbles Lost | Perfect Security Track Record |
Contract Triggers, Guarantee Mechanics & Protection
Achane’s contract features specific future guarantee triggers designed to balance financial security for the player with roster flexibility for the team.
Achane received a $4,233,000 signing bonus upon execution, with his 2026 ($1,145,000) and 2027 ($10,500,000) base salaries fully guaranteed at signing. Additional vesting mechanics secure his future compensation over the life of the deal.
Structural Contract Triggers & Guarantees
| Execution Window | Guarantee Trigger Event | Capital Secured | Financial Security Impact |
|---|---|---|---|
| At Signing (May 2026) | Full Execution Guarantee | $17,378,000 | Covers Signing Bonus + 2026 Base Salary ($1,145,000) + 2027 Base Salary ($10,500,000). |
| 3rd Day of 2027 League Year | Roster Status Trigger (March 13, 2027) | $3,000,000 | Guarantees an additional $3,000,000 of his 2028 base salary. |
| 3rd Day of 2028 League Year | Roster Status Trigger (March 13, 2028) | $7,000,000 | Guarantees an additional $7,000,000 of his 2028 base salary. |
| Annual Per-Game Roster | Game-Day Active Roster | $1,000,000 / Year | Provides $62,500 per active game from 2027 through 2030. |
| Annual Workout Bonus | Offseason Program Participation | $1,100,000 Total | Includes $500,000 in 2027 and $200,000 annually from 2028 to 2030. |
Dead Money Protection & Roster Security Matrix
| Contract Year | Cap Charge | Dead Money Outlay | Cap Savings If Released | Roster Security Assessment |
|---|---|---|---|---|
| 2026 | $3,154,627 | $22,238,627 | ($19,084,000) | 100% Locked In: Unreleasable due to extreme acceleration costs. |
| 2027 | $13,771,000 | $19,084,000 | ($5,313,000) | 100% Locked In: Negative cap savings protect player roster spot. |
| 2028 | $17,196,000 | $5,313,000 | $11,883,000 | High Security: $10.0M of salary guaranteed via prior triggers. |
| 2029 | $17,196,000 | $3,542,000 | $13,654,000 | Flexible Window: Cap savings outpace remaining dead money. |
| 2030 | $18,688,000 | $1,771,000 | $16,917,000 | Final Contract Year: Minimal dead money remaining ($1.77M). |
Roster Building & Cap Management Strategy
Achane’s contract reflects Miami’s broader approach to cap management and offensive asset allocation.
By locking in an elite dual-threat running back at age 25, Miami secures a core playmaker through his athletic prime.
By structuring the deal with a low $3.15 million cap charge in 2026, Miami retains financial flexibility to manage other key roster positions.
Strategic Roster Construction Evaluation
| Roster Management Pillar | Dolphins Cap Strategy | Long-Term Roster Impact |
|---|---|---|
| Early Cap Protection | 1.0% Cap Charge in 2026 ($3.15M) | Leaves room to sign draft picks and address positional depth. |
| Cash Acceleration | $10,000,000 Paid in 2026 | Rewards the player early while keeping the initial cap hit low. |
| Prime Window Alignment | Contract spans ages 25 through 29 | Secures key offensive production through the player’s peak years. |
| Guaranteed Capital Limits | $17.38M Fully Guaranteed at Signing | Limits long-term risk if injury or performance declines. |
Historical Financial Comparison: Entry Contract vs. Extension
| Contract Phase | Active Years | Total Contract Value | Average Annual Value (AAV) | Total Guarantees |
|---|---|---|---|---|
| Rookie Contract (Drafted) | 2023–2025 | $5,437,450 | $1,359,363 | $954,508 |
| Contract Extension | 2026–2030 | $64,000,000 | $16,000,000 | $32,000,000 |
| Combined Career Scope | 2023–2030 | $73,629,645 Potential | $9,203,705 Combined APY | $32,954,508 Combined |