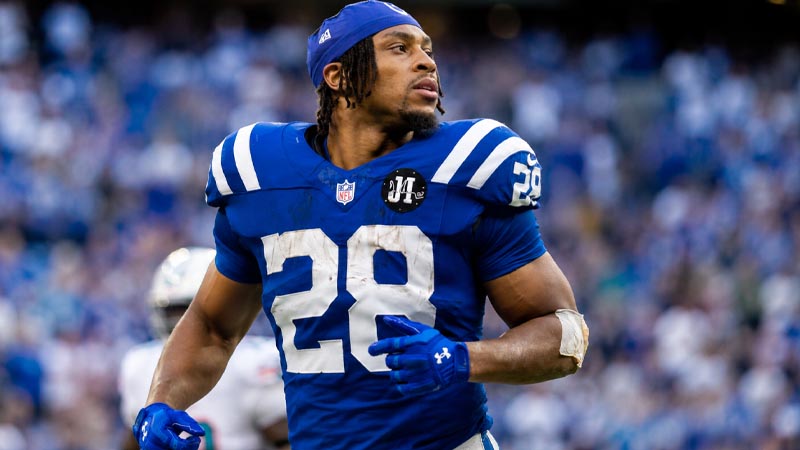
In an NFL era dominated by running-back committees, Jonathan Taylor stands out as a true three-down workhorse. The Indianapolis Colts star has built a reputation for elite rushing efficiency, high-volume production, and consistent scoring.
At 5’10” and 226 pounds, Taylor combines power and explosiveness. Drafted 41st overall by the Colts in the 2020 NFL Draft after starring at Wisconsin, he quickly became a key part of Indianapolis’ offense.
This statistical breakdown examines Taylor’s career from his 2020 rookie season through his 2025 resurgence, covering rushing, receiving, scoring, efficiency, and ball security.
The Rushing Production Matrix (Year-by-Year Breakdown)
The foundation of Jonathan Taylor’s value lies in his raw running capacity. His ability to blend explosive, home-run speed with heavy interior running has allowed him to sustain high averages even when defenses load the line of scrimmage.
To evaluate his contribution as a runner, Table 1 details his complete year-by-year regular-season rushing metrics, tracking games played, rushing attempts, total yards, per-carry averages, touchdowns, longest runs, and rushing first downs.
Jonathan Taylor Career Rushing Statistics
| Season | Team | Games Played (GP) | Carries (CAR) | Rushing Yards (YDS) | Yards Per Carry (AVG) | Rushing TDs (TD) | Longest Run (LNG) | Rushing First Downs (FD) |
|---|---|---|---|---|---|---|---|---|
| 2020 | IND | 15 | 232 | 1,169 | 5.0 | 11 | 62 | 69 |
| 2021 | IND | 17 | 332 | 1,811 | 5.5 | 18 | 83 | 107 |
| 2022 | IND | 11 | 192 | 861 | 4.5 | 4 | 66 | 39 |
| 2023 | IND | 10 | 169 | 741 | 4.4 | 7 | 49 | 42 |
| 2024 | IND | 14 | 303 | 1,431 | 4.7 | 11 | 70 | 71 |
| 2025 | IND | 17 | 323 | 1,585 | 4.9 | 18 | 83 | 84 |
| Career | IND | 84 | 1,551 | 7,598 | 4.9 | 69 | 83 | 412 |
Rushing Volume and Milestone Analysis
Analyzing Table 1 reveals several distinct phases of Taylor’s professional development:
- 2020 – Instant Impact: As a rookie, Taylor rushed for 1,169 yards on 232 carries, averaging 5.0 YPC, with 69 first downs and a 62-yard long run.
- 2021 – Elite Apex: Taylor produced a historic season with 1,811 yards on 332 carries, averaging 5.5 YPC and scoring 18 rushing TDs.
- 2022–2023 – Injury Setback: Injuries limited Taylor to 21 games across two seasons. He totaled 1,602 rushing yards and 11 TDs, with his efficiency dipping to 4.4–4.5 YPC.
- 2024–2025 – Resurgence: Taylor returned to workhorse form, combining for 3,016 rushing yards over two seasons. In 2025, he led the league with 18 rushing TDs and 323 carries while averaging 4.9 YPC.
Through 84 career games, Taylor has accumulated 1,551 rushing attempts for 7,598 yards, placing him on a clear historic trajectory with a lifetime 4.9 yards-per-carry average.
High-Volume Efficiency and Workload Durability
A key challenge for elite running backs is maintaining productivity as their total career touches climb.
High-workload demands frequently result in rapid efficiency drops due to physical wear. To understand how Taylor has managed this workload, we must convert his seasonal totals into per-game ratios.
Workload Density and Per-Game Metrics
| Season | Games Played | Carries Per Game | Rushing Yards Per Game | Yards Per Carry | First Downs Per Game | Longest Run |
|---|---|---|---|---|---|---|
| 2020 | 15 | 15.47 | 77.93 | 5.0 | 4.60 | 62 |
| 2021 | 17 | 19.53 | 106.53 | 5.5 | 6.29 | 83 |
| 2022 | 11 | 17.45 | 78.27 | 4.5 | 3.55 | 66 |
| 2023 | 10 | 16.90 | 74.10 | 4.4 | 4.20 | 49 |
| 2024 | 14 | 21.64 | 102.21 | 4.7 | 5.07 | 70 |
| 2025 | 17 | 19.00 | 93.24 | 4.9 | 4.94 | 83 |
| Career | 84 | 18.46 | 90.45 | 4.9 | 4.90 | 83 |
Analysis of Per-Game Ratios and Durability
The data in Table 2 highlights Taylor’s sustained value on a per-game basis:
- Carrying the Load: Taylor averages 18.46 carries per game for his career, peaking at 21.64 in 2024.
- Yardage Consistency: He averages 90.45 rushing yards per game, topping 100 yards per game in 2021 and 2024.
- Moving the Chains: Taylor averages 4.90 rushing first downs per game, reaching 6.29 in 2021.
- Explosive Ability: His 83-yard career-long run, achieved in 2021 and 2025, highlights his ability to create game-changing plays.
The Aerial Advantage (Receiving Production Analysis)
To be considered a true modern workhorse, a running back must contribute in the passing game. Aerial involvement prevents defenses from predicting plays based on player personnel and provides quarterbacks with a reliable check-down option.
Casually labeled by some as purely an early-down runner, Taylor’s passing game statistics reveal a highly reliable receiver.
Jonathan Taylor Career Receiving Statistics
| Season | Games Played | Targets (TGTS) | Receptions (REC) | Catch Rate (%) | Receiving Yards (YDS) | Yards Per Catch (AVG) | Receiving TDs (TD) | Longest Catch (LNG) | Receiving First Downs (FD) |
|---|---|---|---|---|---|---|---|---|---|
| 2020 | 15 | 39 | 36 | 92.31% | 299 | 8.3 | 1 | 39 | 12 |
| 2021 | 17 | 51 | 40 | 78.43% | 360 | 9.0 | 2 | 76 | 12 |
| 2022 | 11 | 40 | 28 | 70.00% | 143 | 5.1 | 0 | 19 | 4 |
| 2023 | 10 | 23 | 19 | 82.61% | 153 | 8.1 | 1 | 40 | 5 |
| 2024 | 14 | 31 | 18 | 58.06% | 136 | 7.6 | 1 | 25 | 7 |
| 2025 | 17 | 55 | 46 | 83.64% | 378 | 8.2 | 2 | 43 | 15 |
| Career | 84 | 239 | 187 | 78.24% | 1,469 | 7.9 | 7 | 76 | 55 |
Evaluation of Passing-Game Utility
- High Catch Efficiency: Taylor has caught 187 of 239 targets, producing a strong 78.24% career catch rate. His rookie rate was an impressive 92.31%.
- 2025 Receiving Peak: He set career highs with 55 targets, 46 receptions, and 378 receiving yards in 2025.
- Big-Play Threat: Taylor averages 7.9 yards per reception, including a career-long 76-yard touchdown catch in 2021.
- First-Down Production: He has generated 55 receiving first downs, adding to his 412 rushing first downs for 467 total.
Scoring Dominance and Point Generation
An NFL offense is ultimately judged by its ability to put points on the scoreboard. In the modern league, red zone efficiency often decides games. Jonathan Taylor’s combination of size, power, and vision makes him an exceptionally effective scoring weapon inside the 20-yard line.
Jonathan Taylor Scoring and Point Contribution
| Season | Games Played | Rushing TDs | Receiving TDs | Total Touchdowns | 2-Point Conversions | Total Points Scored | Points Per Game |
|---|---|---|---|---|---|---|---|
| 2020 | 15 | 11 | 1 | 12 | 0 | 72 | 4.80 |
| 2021 | 17 | 18 | 2 | 20 | 0 | 120 | 7.06 |
| 2022 | 11 | 4 | 0 | 4 | 0 | 24 | 2.18 |
| 2023 | 10 | 7 | 1 | 8 | 0 | 48 | 4.80 |
| 2024 | 14 | 11 | 1 | 12 | 0 | 72 | 5.14 |
| 2025 | 17 | 18 | 2 | 20 | 1 | 122 | 7.18 |
| Career | 84 | 69 | 7 | 76 | 1 | 458 | 5.45 |
Scoring Impact and Red Zone Analysis
- Elite Scoring Pace: Taylor has amassed 76 total touchdowns across his 84 regular-season games. This equates to an average of 0.90 touchdowns per game, meaning he scores nearly every time he takes the field.
- The High-End Seasons: In both 2021 and 2025, Taylor reached the elite milestone of 20 total touchdowns. In 2025, he added a two-point conversion to finish with a career-high 122 total points scored, building on his previous high-water mark of 120 points in 2021. His 18 rushing touchdowns in 2025 led the NFL, highlighting his efficiency in goal-line situations.
- Overall Point Generation: With 458 total points generated individually, Taylor is one of the most reliable point-producers in the NFL. His presence alone guarantees a baseline of scoring output that takes pressure off young or developing passing units. His scoring averages in healthy seasons (4.80 PPG in 2020, 7.06 in 2021, 5.14 in 2024, and 7.18 in 2025) are comparable to elite kickers, emphasizing his immense value.
The 2021 Peak vs. the 2025 Renaissance
A fascinating element of Jonathan Taylor’s career profile is the statistical comparison between his historic 2021 season and his recent 2025 campaign.
While 2021 was widely praised as an MVP-caliber season, his 2025 performance was arguably just as impressive when factoring in defensive adjustments, league-wide trends, and his workload.
Statistical Comparison (2021 vs. 2025)
| Performance Metric | 2021 Campaign | 2025 Campaign | Net Difference | Percentage Change |
|---|---|---|---|---|
| Games Played | 17 | 17 | 0 | 0.00% |
| Rushing Attempts | 332 | 323 | -9 | -2.71% |
| Rushing Yards | 1,811 | 1,585 | -226 | -12.48% |
| Yards Per Carry | 5.5 | 4.9 | -0.6 | -10.91% |
| Rushing Touchdowns | 18 | 18 | 0 | 0.00% |
| Pass Targets | 51 | 55 | +4 | +7.84% |
| Receptions | 40 | 46 | +6 | +15.00% |
| Receiving Yards | 360 | 378 | +18 | +5.00% |
| Receiving Touchdowns | 2 | 2 | 0 | 0.00% |
| Total Touchdowns | 20 | 20 | 0 | 0.00% |
| Rushing First Downs | 107 | 84 | -23 | -21.50% |
| Total Points Scored | 120 | 122 | +2 | +1.67% |
Strategic Takeaways from the Evolution of His Style
Comparing these two seasons reveals a transition in how the Colts’ offense utilized Taylor:
- Rushing Efficiency: Despite heavier defensive attention in 2025, Taylor still averaged an elite 4.9 YPC on 323 carries, compared with 5.5 YPC in 2021.
- Passing-Game Growth: Taylor increased his receiving role in 2025, posting 46 catches for 378 yards, both career highs.
- Red-Zone Consistency: He scored 20 total touchdowns in both 2021 and 2025, including 18 rushing TDs each season.
Defensive Contribution, Ball Security, and Ball-Handling Metrics
For high-volume running backs, maintaining possession is just as important as gaining yards. A high fumble rate can quickly erase the value of an otherwise productive running back. Additionally, elite players are occasionally called upon to make tackles following turnovers or on special teams.
Ball Security and Defensive Contributions
| Season | Carries | Receptions | Total Touches | Total Fumbles | Fumbles Lost | Touch-to-Fumble Ratio | Solo Tackles | Total Tackles |
|---|---|---|---|---|---|---|---|---|
| 2020 | 232 | 36 | 268 | 1 | 1 | 268.0 : 1 | 1 | 1 |
| 2021 | 332 | 40 | 372 | 3 | 2 | 124.0 : 1 | 0 | 0 |
| 2022 | 192 | 28 | 220 | 3 | 3 | 73.3 : 1 | 0 | 0 |
| 2023 | 169 | 19 | 188 | 1 | 0 | 188.0 : 1 | 0 | 0 |
| 2024 | 303 | 18 | 321 | 3 | 1 | 107.0 : 1 | 1 | 1 |
| 2025 | 323 | 46 | 369 | 1 | 1 | 369.0 : 1 | 1 | 1 |
| Career | 1,551 | 187 | 1,738 | 12 | 8 | 144.8 : 1 | 3 | 3 |
Ball Security Analysis
- Elite Ball Security in 2025: In 2025, Taylor had one of his best seasons for ball security. Despite logging 369 total touches (323 carries and 46 receptions), he fumbled only once. This outstanding 369.0 touch-to-fumble ratio represents elite ball security, especially considering the physical nature of his runs.
- Career Baseline: Over his career, Taylor has accumulated 1,738 total touches. With only 12 fumbles and 8 fumbles lost, he averages a highly secure 144.8 touches per fumble. This reliability is a major reason why the Colts trust him with high volumes of carries in late-game, clock-killing situations.
- Defensive Effort: Taylor has also registered three career tackles (all solo). These tackles occurred in 2020, 2024, and 2025, showcasing his effort and high competitive drive to prevent return yards following a turnover.
Conclusion
At 27 years old, Jonathan Taylor is in his physical prime and continues to serve as the engine of the Indianapolis offense.
His contract extension with the Colts has provided stability for the franchise, keeping one of the league’s premier playmakers locked in as a cornerstone of the offense.
Despite early-season challenges in the highly competitive AFC South division, Taylor’s individual stats remain elite.
Over 84 career games, his ability to average 90.45 rushing yards per game and nearly one touchdown per game places him among the most productive running backs of his generation.
His elite 2025 season proved that he has fully moved past the injury concerns of 2022 and 2023, solidifying his status as a premier running back in professional football.