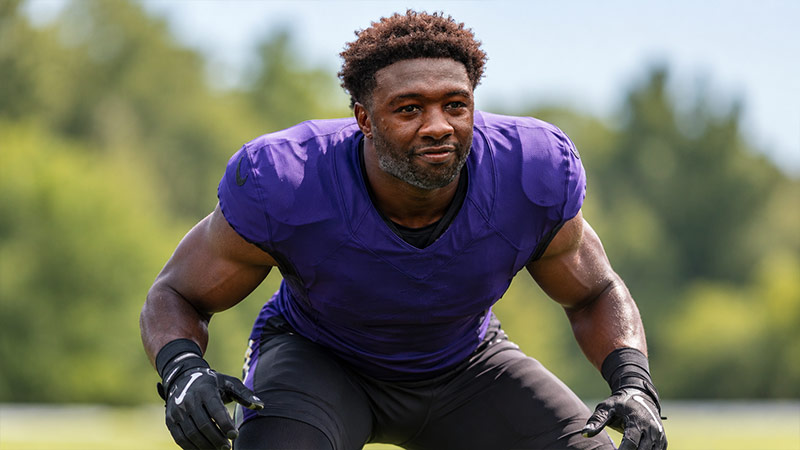
Roquan Smith’s stats show a linebacker whose main strength is steady tackle production. Across the regular-season figures provided here, the Baltimore Ravens defender has recorded 1,176 combined tackles, 22.5 sacks, and 11 interceptions in 130 games.
His early 2026 numbers include 42 combined tackles, one sack, and one interception through five games. Those totals give fans a useful starting point, but understanding his performance requires a closer look at solo tackles, assists, season length, and his role on defense.
This breakdown covers Smith’s yearly numbers, his time with the Chicago Bears and Baltimore Ravens, and what his latest game stats mean.
Roquan Smith Stats at a Glance
The quickest way to understand Smith’s production is to separate tackles from the plays that directly disrupt a possession.
| Category | Total From Supplied Figures |
|---|---|
| Regular-season games | 130 |
| Solo tackles | 707 |
| Assisted tackles | 469 |
| Combined tackles | 1,176 |
| Sacks | 22.5 |
| Interceptions | 11 |
| Forced fumbles | 4 |
| Combined tackles per game | 9.05 |
Combined tackles equal solo tackles plus assisted tackles. This distinction matters because the supplied table uses “TKL” for the solo figure and lists assists separately.
For example, Smith’s 2026 line contains 16 solo tackles and 26 assists. That means he has 42 combined tackles, rather than 16 total tackles.
Interceptions also need a clear label. An interception means a defender catches an opponent’s pass. A forced fumble is a separate event in which a defender causes a player to lose possession.
Roquan Smith Career Stats by Year
Smith’s career table shows sustained tackle production across both teams. It also shows why tackles, sacks, and interceptions should be read together.
| Year | Team | Games | Solo Tackles | Assists | Combined Tackles | Sacks | INT |
|---|---|---|---|---|---|---|---|
| 2026* | Ravens | 5 | 16 | 26 | 42 | 1.0 | 1 |
| 2025 | Ravens | 15 | 76 | 54 | 130 | 0.0 | 0 |
| 2024 | Ravens | 16 | 81 | 73 | 154 | 1.5 | 1 |
| 2023 | Ravens | 16 | 84 | 74 | 158 | 1.5 | 1 |
| 2022 | Ravens | 9 | 51 | 35 | 86 | 2.0 | 1 |
| 2022 | Bears | 8 | 52 | 31 | 83 | 2.5 | 2 |
| 2021 | Bears | 17 | 95 | 68 | 163 | 3.0 | 1 |
| 2020 | Bears | 16 | 98 | 41 | 139 | 4.0 | 2 |
| 2019 | Bears | 12 | 65 | 35 | 100 | 2.0 | 1 |
| 2018 | Bears | 16 | 89 | 32 | 121 | 5.0 | 1 |
| Total | Both teams | 130 | 707 | 469 | 1,176 | 22.5 | 11 |
2026 includes only the five games supplied.
The two 2022 rows belong to the same season. Combining them gives Smith 169 tackles, 4.5 sacks, and three interceptions across 17 games.
That combined line is essential when comparing his best years. Looking only at his nine Baltimore games would leave out nearly half of his 2022 production.
What Was Roquan Smith’s Best Statistical Season?
There is no single answer unless “best” is defined. His highest tackle total, highest sack total, and highest interception total occurred in different seasons.
| Measure | Best Season in Supplied Data | Result |
|---|---|---|
| Most combined tackles | 2022 | 169 |
| Most solo tackles | 2020 | 98 |
| Most assisted tackles | 2023 | 74 |
| Most sacks | 2018 | 5.0 |
| Most interceptions | 2022 | 3 |
| Highest combined tackles per game in a completed season | 2022 | 9.94 |
By tackle volume, 2022 stands out as Smith’s strongest season in this table. He paired his career-high combined tackle total with 4.5 sacks and three interceptions.
His 2021 season was another major year, with 163 combined tackles. In 2023, he followed with 158 tackles during a full season in Baltimore.
These results show a recurring pattern: Smith’s production rests on frequent involvement in defensive plays, with sacks and interceptions adding to that foundation.
Roquan Smith’s Ravens Stats
Smith’s Baltimore numbers cover the Ravens portion of 2022, three completed seasons from 2023 through 2025, and the five-game 2026 snapshot.
| Ravens Period | Games | Solo Tackles | Assists | Combined Tackles | Sacks | INT |
|---|---|---|---|---|---|---|
| 2022 | 9 | 51 | 35 | 86 | 2.0 | 1 |
| 2023 | 16 | 84 | 74 | 158 | 1.5 | 1 |
| 2024 | 16 | 81 | 73 | 154 | 1.5 | 1 |
| 2025 | 15 | 76 | 54 | 130 | 0.0 | 0 |
| 2026* | 5 | 16 | 26 | 42 | 1.0 | 1 |
| Baltimore total | 61 | 308 | 262 | 570 | 6.0 | 4 |
His 2023 and 2024 seasons were especially close in tackle volume: 158 and 154 combined tackles, respectively. Baltimore’s player page also lists those totals, along with 130 combined tackles in 2025.
The 2025 decline deserves context. Smith played 15 games, compared with 16 in each of the two previous seasons. His average also fell, so the difference cannot be explained by the missing game alone.
Still, a change in tackle totals does not establish why performance changed. Defensive snaps, opponent play selection, assignments, and team tackle distribution would help explain that difference.
Bears Stats Compared With Ravens Stats
A team split makes Smith’s career easier to follow, though it should not be treated as a direct test of which version of him played better.
| Team | Games | Solo Tackles | Assists | Combined Tackles | Tackles Per Game | Sacks | INT |
|---|---|---|---|---|---|---|---|
| Chicago Bears | 69 | 399 | 207 | 606 | 8.78 | 16.5 | 7 |
| Baltimore Ravens | 61 | 308 | 262 | 570 | 9.34 | 6.0 | 4 |
In the supplied figures, Smith has averaged more combined tackles per game with Baltimore. He recorded more sacks and interceptions during his Chicago years.
Those differences can reflect how a linebacker is used. A player asked to rush more often has different opportunities from one assigned to coverage or pursuit.
The table describes his production. It does not, by itself, measure the quality of every snap.
Roquan Smith 2026 Stats
Through the five games listed, Smith has contributed in several defensive categories.
| Category | 2026 Total |
|---|---|
| Games played | 5 |
| Solo tackles | 16 |
| Assisted tackles | 26 |
| Combined tackles | 42 |
| Combined tackles per game | 8.4 |
| Sacks | 1.0 |
| Interceptions | 1 |
| Forced fumbles | 1 |
| Interception return yards | 1 |
| Defensive touchdowns | 0 |
His combined tackle average is 8.4 per game. Most of that total comes from assists: 26 of his 42 tackles involve shared credit.
That split is worth tracking, but it is not enough to judge tackling quality. An assist can still represent an important contribution to stopping a runner.
To assess the quality of those plays, fans would also need to know where the tackle occurred, how many yards the offense gained, and whether Smith missed earlier opportunities.
Roquan Smith Game Stats in 2026
The supplied game log shows how his season total developed.
| Date Listed | Opponent | Solo Tackles | Assists | Combined Tackles | Sacks | INT | Passes Defensed |
|---|---|---|---|---|---|---|---|
| Oct. 12 | At Falcons | 5 | 3 | 8 | 0.0 | 0 | 0 |
| Oct. 4 | Vs. Titans | 1 | 5 | 6 | 0.0 | 0 | 0 |
| Sept. 28 | At Cowboys | 3 | 6 | 9 | 1.0 | 0 | 0 |
| Sept. 20 | Vs. Saints | 2 | 6 | 8 | 0.0 | 0 | 0 |
| Sept. 13 | At Colts | 5 | 6 | 11 | 0.0 | 1 | 2 |
| Total | — | 16 | 26 | 42 | 1.0 | 1 | 2 |
His highest tackle total in this stretch came against Indianapolis. He finished with 11 combined tackles, an interception, and two passes defensed.
The Dallas game added nine combined tackles and his only sack in the five-game sample. The NFL’s displayed game log agrees with those supplied Indianapolis and Dallas tackle lines. nfl.com
The Tennessee game produced his lowest combined total, with six tackles. One quieter game does not establish a trend, especially without snap counts and defensive opportunity data.
How His Recent Tackle Rate Compares
Per-game averages offer a fairer comparison than raw season totals when the number of games differs.
| Season | Games | Combined Tackles | Tackles Per Game |
|---|---|---|---|
| 2021 | 17 | 163 | 9.59 |
| 2022, both teams | 17 | 169 | 9.94 |
| 2023 | 16 | 158 | 9.88 |
| 2024 | 16 | 154 | 9.63 |
| 2025 | 15 | 130 | 8.67 |
| 2026* | 5 | 42 | 8.40 |
Smith’s early 2026 average sits below his 2021–2024 rates and slightly below his 2025 average.
At 8.4 tackles per game, a simple 17-game calculation produces approximately 143 combined tackles. That is a pace calculation, not a prediction. It assumes he plays all 17 games and maintains the same average.
His eventual total could change with playing time, injuries, defensive assignments, and the number of plays Baltimore faces.
What Roquan Smith’s Stats Tell Us—and What Needs More Context
Smith’s numbers support a clear conclusion: he has maintained substantial tackle production across many seasons.
They also show that his sack totals vary. His five sacks in 2018 remain his highest season total in the supplied table, while he recorded no sacks in 2025.
For a linebacker, a low sack total does not automatically mean a poor season. Evaluating that number requires knowing how often he rushed the passer.
| Statistic | What It Helps Show | What Else Matters |
|---|---|---|
| Combined tackles | Overall tackle involvement | Snaps and opponent play volume |
| Solo tackles | Individually credited stops | Missed tackles and yards allowed |
| Assists | Shared involvement in stops | Position and defensive assignments |
| Sacks | Successful quarterback takedowns | Pass-rush opportunities |
| Interceptions | Passes caught by the defender | Coverage targets and responsibilities |
| Passes defensed | Recorded disruptions of passes | Completions and yards allowed |
| Forced fumbles | Fumbles caused | Whether the defense recovered the ball |
A tackle near the line of scrimmage and a tackle after a long gain both contribute to the total. Their value to the defense can be very different.
That is why tackle counts work best alongside film, tackles for loss, missed-tackle data, and coverage results.